Thirsty: Beef
A 200 gram steak carries about 3,100 litres of water, and 98 percent of it never touched the animal. The water footprint of beef is the footprint of three years of feed, and how those years were fed decides whether the number is rain on a hillside or a river in a dry valley.
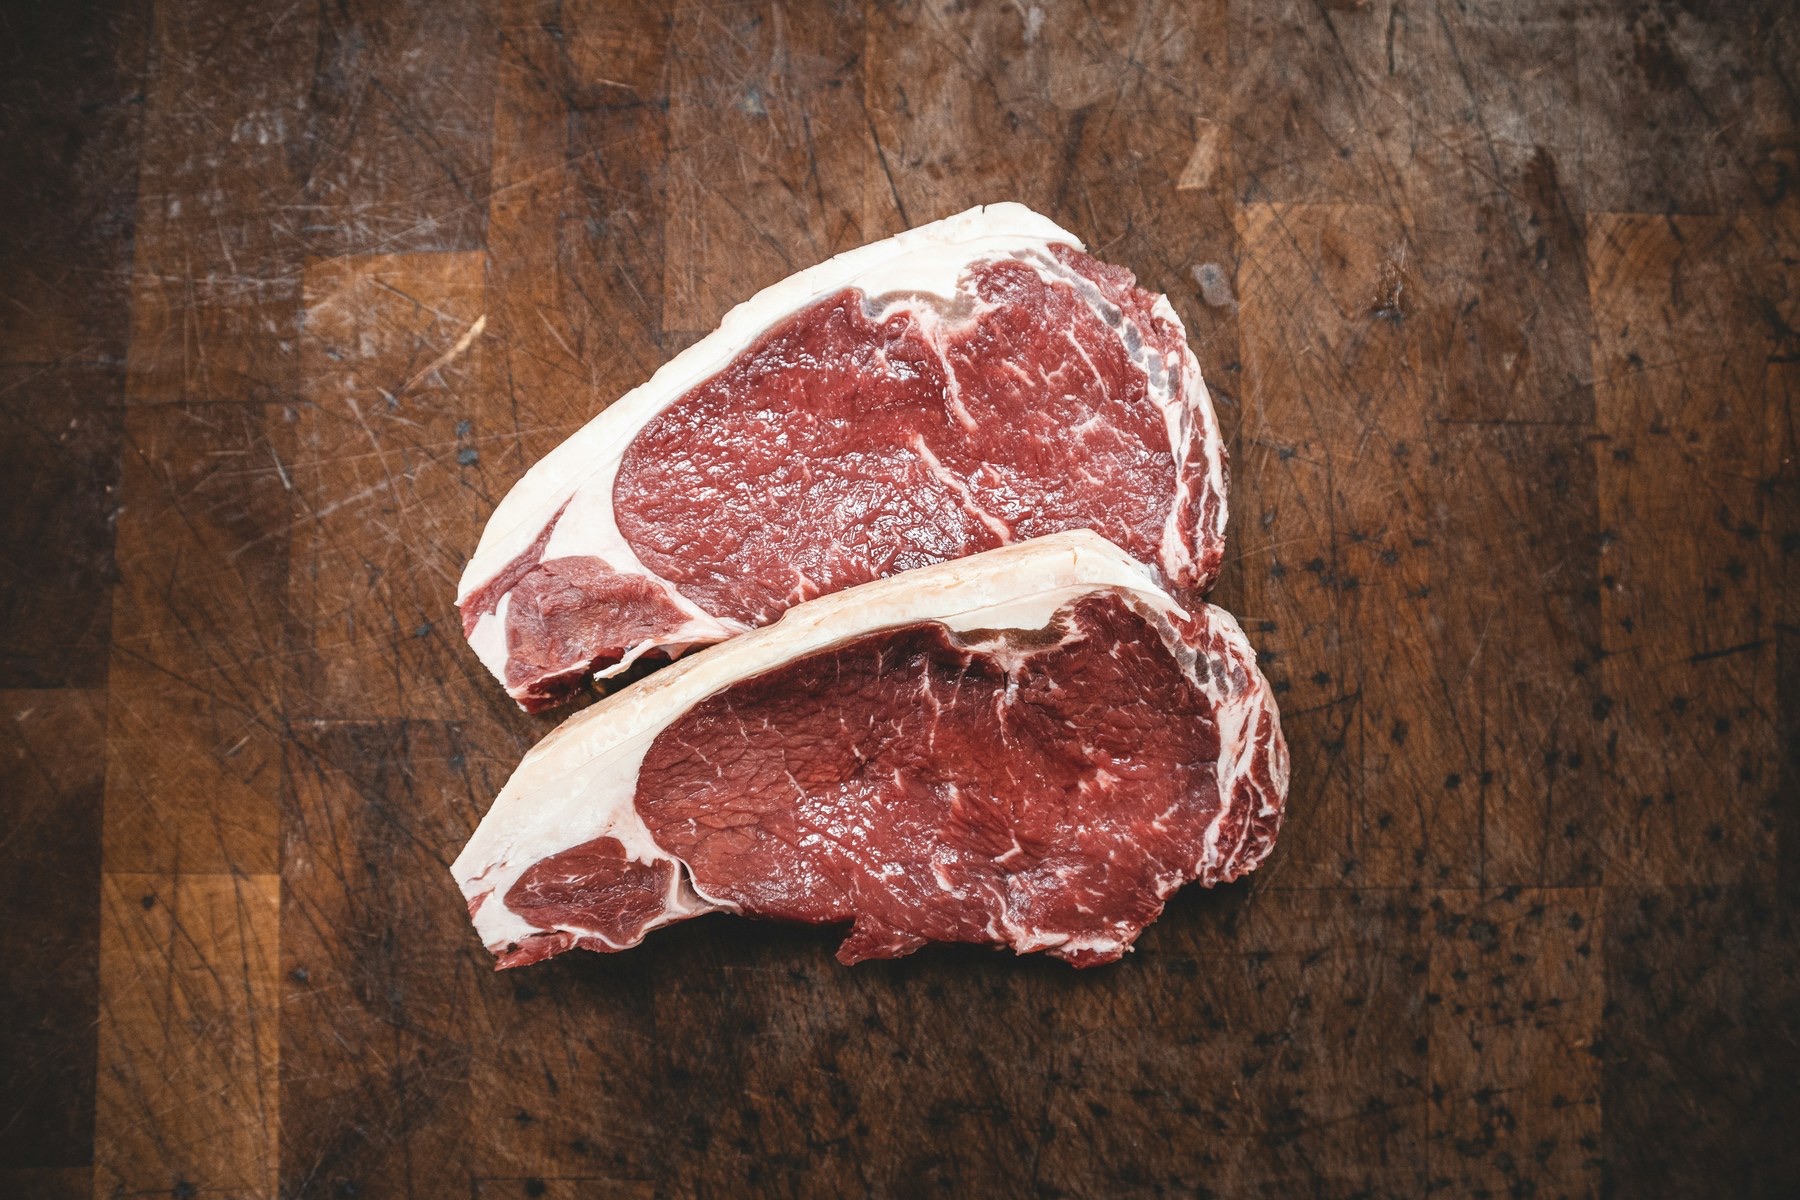
Ask how much water is in a steak and the honest answer is: almost none, and that is exactly the problem with the question. A 200 gram steak contains perhaps 140 grams of water, which is about as much as a small glass. By the standard method for counting hidden water, the same steak carries about 3,100 litres, and the gap between those two numbers is the whole subject of this article.
Beef is the largest water footprint of any common food, per kilogram, and it is also the most argued over, because the number depends more than most on how the animal lived. Both of those things are worth understanding before forming a view.
Three thousand litres
By the Water Footprint Network's method, which adds the rain a crop took up, the irrigation applied to it and the clean water it would take to dilute the pollution it caused, beef comes to about 15,400 litres per kilogram in the global average. A 200 gram steak is a fifth of a kilogram, so about 3,100 litres.
| Stage | Litres | Share |
|---|---|---|
| Growing the feed | 3,000 | 97% |
| The animal's drinking water | 50 | 1.5% |
| Farm and processing | 50 | 1.5% |
The split is approximate, and the total is the figure to remember. But the shape of it is the point, and it is more lopsided than for any crop on this site. Ninety eight percent of the water in a steak never touched the animal. It grew grass, hay and grain, and the animal ate them.
Three years of eating
A beef animal lives for somewhere between eighteen months and three years before slaughter, depending on the system, and for all of that time it eats. Grass in the field, hay and silage in winter, and, in the last months of an industrial system, grain in a feedlot. Every one of those feeds is a crop, every crop transpired water for a season, and the method charges all of it to the animal.
At the end, one animal yields a few hundred kilograms of meat. Divide three years of feed water by that yield and the litres per kilogram climb very high, higher than any crop, because the animal is a second stage of concentration on top of the crop's own. A cow is, from the point of view of water accounting, a machine for turning a large volume of plants into a small volume of meat, and the water follows the plants.
| Water footprint per kilogram, global averages | Litres |
|---|---|
| Beef | about 15,400 |
| Sheep meat | about 10,400 |
| Pork | about 6,000 |
| Chicken | about 4,300 |
| Pulses | about 4,000 |
| Wheat | about 1,800 |
The same study that produced the beef figure produced the rest of the table, and the pattern is what one would expect: the longer an animal lives and the more it eats per kilogram of meat, the larger the number. Chicken, which grows fast on a small amount of feed, is a quarter of beef. Pulses, which are plants, are a quarter of beef too, and carry as much protein per kilogram.
Not all water costs the same
Here the footprint's colours matter more than for any other product, because they turn a frightening number into a manageable one.
In the global average, about 94 percent of beef's water footprint is green: rain that fell on pasture and on feed crops and was taken up by the plants. Around 4 percent is blue, water pumped for irrigation. About 3 percent is grey, the dilution of fertiliser and manure that reached rivers.
| Kind of water | Share of beef's global average footprint |
|---|---|
| Green, rain | about 94% |
| Blue, irrigation | about 4% |
| Grey, pollution | about 3% |
Rain on a hillside of grass was never going to fill a tap. Cattle grazing that hillside are using water that would otherwise have grown something else on the same ground, or evaporated, and the method is right to count it, but it is not water that is missing from a river afterwards. The blue share is the part that competes with cities and with other farmers, and in the global average it is small.
The average, though, hides a very wide range, and the range is the fine print.
The system matters
Cattle are raised in three broad ways, and the water story of each is different.
Grazing systems keep animals on pasture for their whole lives. The footprint per kilogram is often the highest of the three, because animals grow slowly on grass, but almost all of it is green water, rain on grassland. In the wet uplands of Ireland or the pampas of Argentina, this is water with very little else to do.
Mixed systems, the norm across much of Europe, graze animals in summer and feed them hay, silage and some grain in winter. The footprint is lower per kilogram and still mostly green.
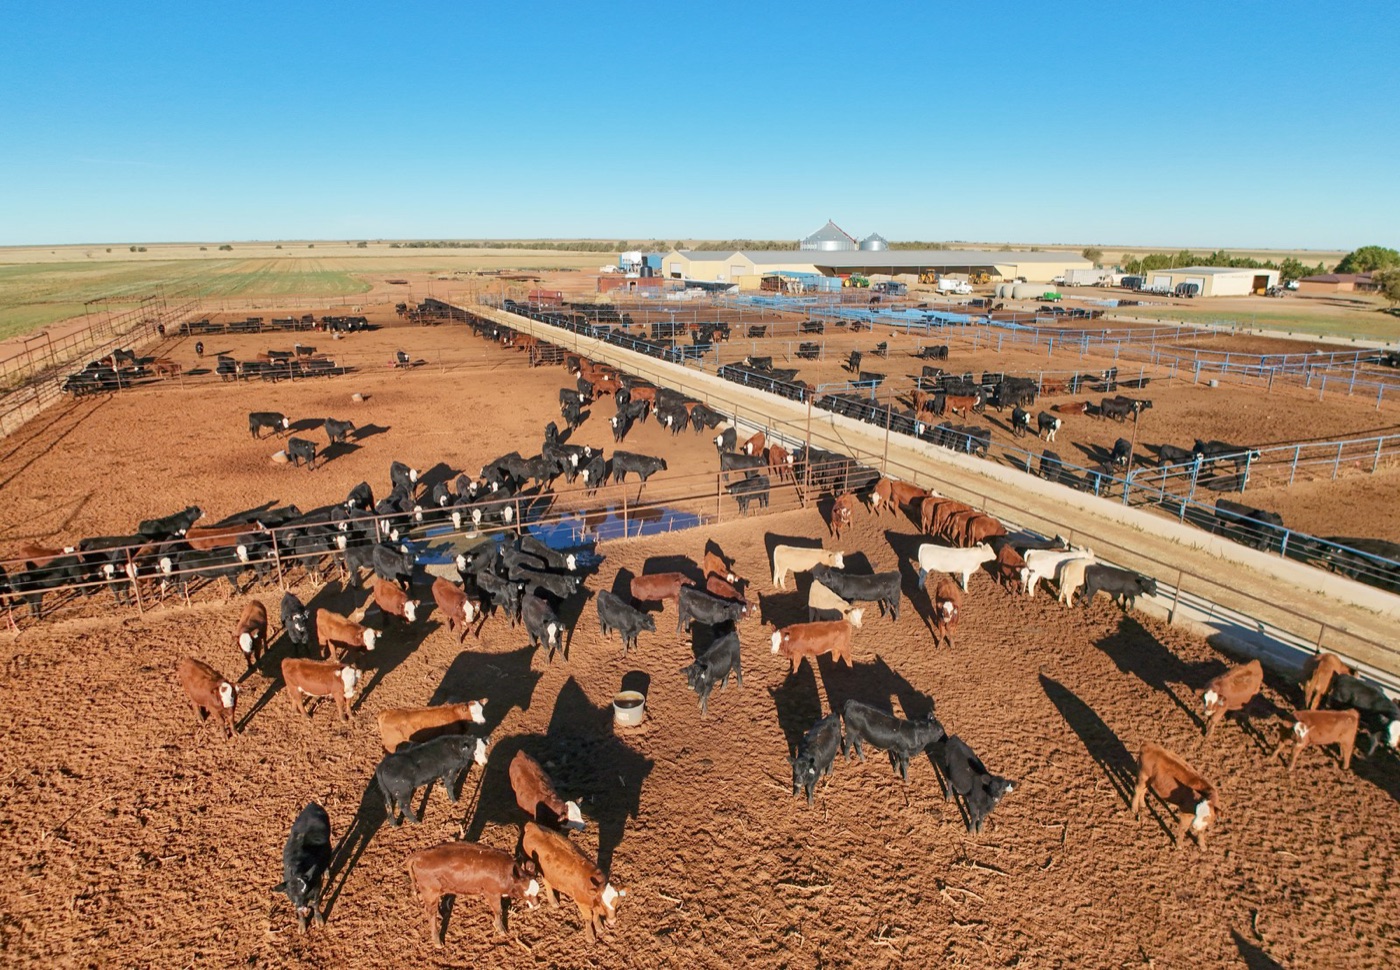
Industrial systems finish animals in feedlots on grain, much of it maize and soy grown specifically as feed. The animals grow fast, so the footprint per kilogram is the lowest of the three. But the grain was often grown on irrigated land, and in a dry region, the High Plains of the United States above the Ogallala aquifer for instance, the blue share of that footprint is drawn from a water table that is falling. Per kilogram, industrial beef uses less water. Per litre of river, it can use far more.
So the same steak on a plate can be three thousand litres of Irish rain or three thousand litres that include a meaningful draw on an aquifer in Kansas, and the number alone does not distinguish them. How the animal was raised changes the picture entirely, and it is the question worth asking of the number.
Grey water and the manure
The grey share of beef's footprint is small, at around 3 percent, but it points at a problem that the water footprint only partly captures.
A beef animal produces a great deal of manure, and manure is rich in nitrogen and phosphorus. On pasture, at low density, it is fertiliser and the grass takes it up. In a feedlot, where thousands of animals stand on a few hectares, it is a waste stream, held in lagoons and spread on nearby fields in quantities the fields cannot always absorb. What the fields cannot absorb runs off into streams and down into groundwater, and the nitrogen in it does in a river what organic matter does: it feeds growth, the growth consumes oxygen, and the river suffers. The feed crops themselves were fertilised too, and their runoff is counted in the same way.
The method turns all of this into a volume, the clean water that would be needed to dilute it to a standard, and adds it to the footprint. It is the least precise of the three colours, because it depends on which pollutant is counted and which standard is used, and it is the one most likely to be understated. Anyone who has stood downstream of a large feedlot after rain will suspect that 3 percent is a polite figure.
By country
The global average conceals differences between countries that are as large as the differences between systems, because a country's beef reflects its rainfall, its feed and its farming. Beef raised in the wet grasslands of northern Europe or Brazil's south is mostly green water; beef finished on irrigated grain in a dry country carries a blue share several times the global average. The same study that produced the 15,400 litre figure published values by country, and the spread between the wettest grazing countries and the driest feedlot systems is wide enough that a national average tells a reader more than the global one. Where the steak came from is, for water, the most useful thing a label could say, and it is the one thing most labels do not.
A fairer comparison
Per kilogram is the usual way to state these figures, and it flatters nothing and nobody. Per gram of protein is a fairer comparison for food, and by that measure beef still sits at the top, needing several times the water of pulses for the same protein, but the gap narrows, and chicken and eggs come close to plant sources. Per calorie, the picture is similar. The reason beef stays at the top by every measure is the same reason it is at the top by weight: a long life, a great deal of feed, and a small yield.
What the number is for
The footprint of beef is not a guilt score, and it is a poor guide to individual choices without the colours attached. Eating less beef from an irrigated feedlot in a dry region saves blue water that a river needed. Eating less beef from rain fed pasture in a wet country saves, in water terms, very little, whatever it does for other reasons.
What the number is good for is seeing the shape of things. Almost nothing in a steak's water was spent on the animal. It was spent on three years of plants, and those plants are where the water question about beef actually lives: what they were, where they grew, and whether the rain was enough.
Sources
- Mekonnen, M.M. and Hoekstra, A.Y. (2012). A global assessment of the water footprint of farm animal products. Ecosystems 15, 401 to 415. Beef, global average, about 15,400 L/kg; roughly 94 percent green, 4 percent blue, 3 percent grey; per gram of protein and per calorie comparisons across animal products and crops.
- Mekonnen, M.M. and Hoekstra, A.Y. (2010). The green, blue and grey water footprint of farm animals and animal products. Value of Water Research Report 48, UNESCO IHE. Differences between grazing, mixed and industrial systems.
- Stage split (feed, drinking water, farm and processing) is approximate and illustrative; the total is the citable figure.
- Photographs: steaks by Kyle Mackie, cattle by Quaritsch Photography and Ryan Song, all Unsplash; inline: Cattle feedlot south of Portales, New Mexico by Quintin Soloviev (CC BY) via Wikimedia Commons.