
Thirsty: Coffee
A cup of coffee holds about 125 millilitres of water. Making it took roughly a thousand times more. Where those litres went, how anyone counts them, and why the total on its own is the least interesting thing about it.
There is a moment in most kitchens, somewhere between the kettle clicking off and the first sip, when nobody is thinking about water at all. The coffee is the point. The water is the medium, a hundred and twenty five millilitres of it, hot, and gone in ten minutes.
That small volume is the only water in the cup that anyone can see. It is also, by a very wide margin, the least of it. Long before the beans were ground, a coffee tree on a hillside in Ethiopia, Brazil or Vietnam spent the better part of a growing season pulling water out of the soil and breathing it into the air, and the standard way of counting that water arrives at a figure that is difficult to take in on first hearing. One cup of coffee carries a water footprint of about 140 litres.
This article is about where that figure comes from, what it does and does not mean, and why the size of it is the least interesting thing about it.
Counting water nobody can see
The number rests on a method, and the method deserves a proper introduction because every footprint on this site uses it. It was developed by the Water Footprint Network, the research body that grew out of Arjen Hoekstra's work at the University of Twente, and it is the closest thing the field has to a common standard.
The method adds three kinds of water together. Green water is rain: the moisture in the soil that a crop takes up and releases back into the atmosphere as it grows. Blue water is irrigation: water drawn from a river, a lake or an aquifer and applied to the field on purpose. Grey water is pollution, translated into a volume. When fertiliser or pesticide runs off a farm into a stream, the method asks how much clean water it would take to dilute that pollution back to an acceptable level, and counts that volume as part of the crop's footprint.
| Water | What it counts |
|---|---|
| Green | Rain the crop took from the soil and released to the air |
| Blue | Irrigation drawn from rivers, lakes and groundwater |
| Grey | The clean water needed to dilute the pollution the crop caused |
For roasted coffee, the global average worked out by Mekonnen and Hoekstra in 2011 comes to roughly 18,900 litres per kilogram. That figure is the one to remember and the one that can be defended in an argument. Everything else follows from it by arithmetic. A cup of coffee uses about seven grams of roasted beans, and seven thousandths of 18,900 litres is about 132 litres. Add a little for processing at the mill and the cup arrives at 140.
| Stage | Litres | Share |
|---|---|---|
| Growing the beans | 132 | 94% |
| Processing and milling | 6 | 4% |
| Brewing the cup | 0.2 | 0.1% |
The split between stages is approximate; only the total is a measured figure. But the shape of it is not in doubt, and the shape is the point. The farm accounts for almost all of the water. The espresso machine, the kettle, the rinse of the cup afterwards, all of it together is a rounding error on the number.
Almost every litre in a cup of coffee was used by a tree, months earlier, and returned to the sky.
A slow pump
Why should a plant need so much water to produce so few beans? The answer is that a plant is, among other things, a pump, and a slow one.
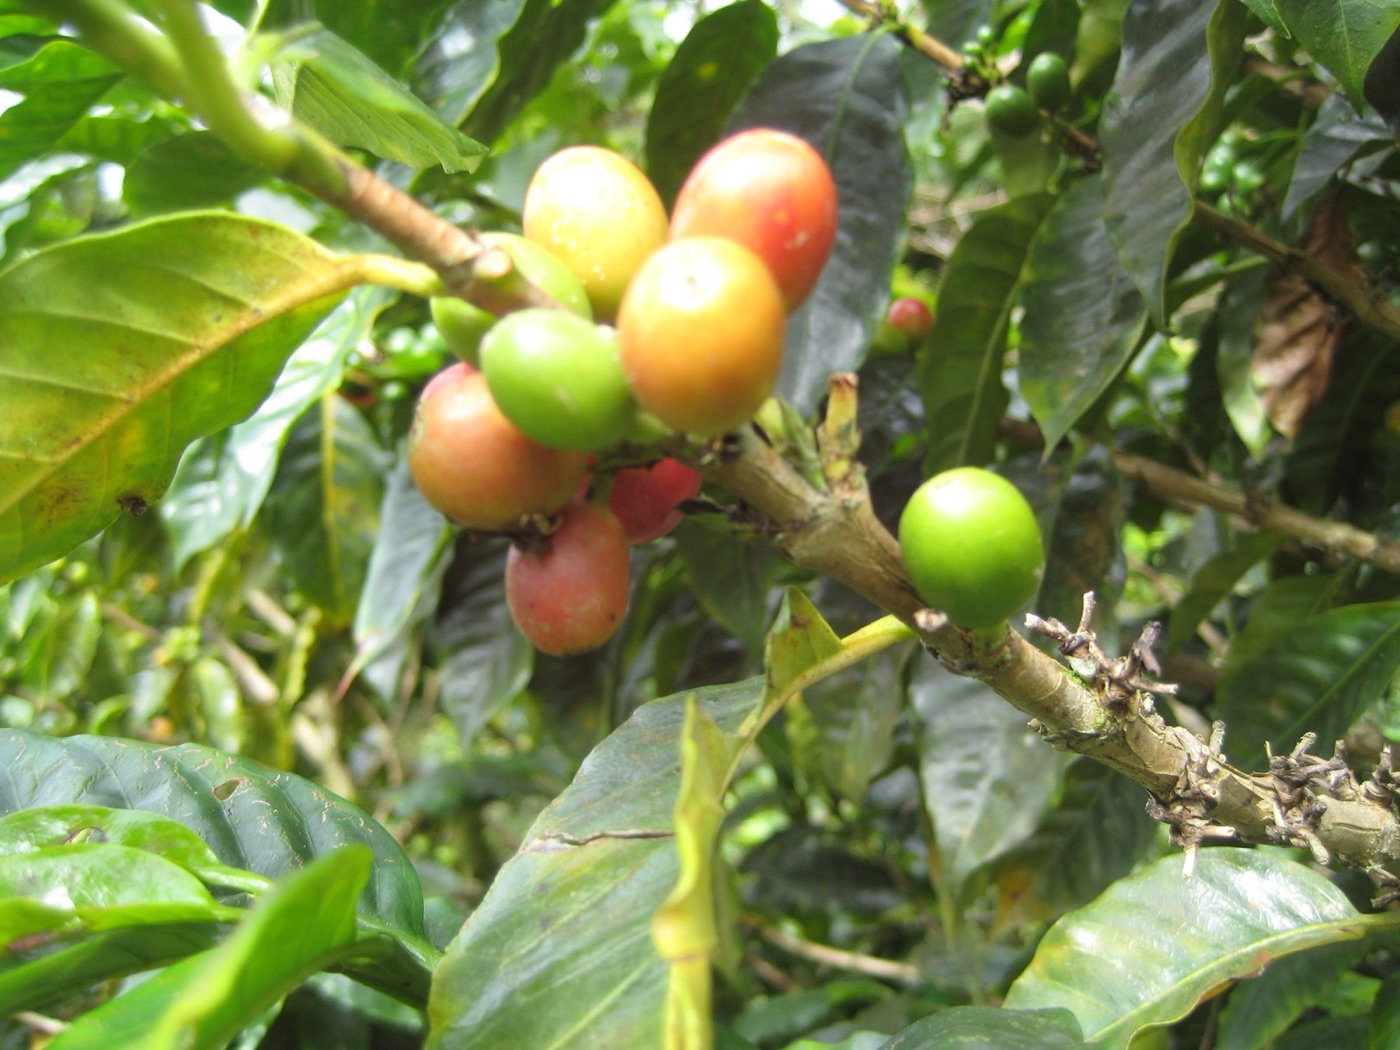
A coffee tree draws water up through its roots and releases almost all of it through tiny openings in its leaves. The process, called transpiration, is how the plant moves nutrients from the soil to its growing parts, how it keeps its leaves cool under a tropical sun, and how it stays upright. Very little of the water is retained. The cherries that eventually ripen, and the two beans inside each of them, are a small fraction of everything the tree built during the season, and the tree ran its pump for every one of those months.
Divide a season's worth of pumping by a harvest of beans, and the litres per kilogram climb quickly. This is true of every crop, which is why agricultural footprints are so much larger than anything that happens in a factory. A factory uses water for minutes and discharges most of it. A field uses water for months and breathes it away.
The method charges all of that breathing to the beans, because the water was used and the land was occupied. Whether that is a cost, in the sense of water that is now missing from somewhere, is a separate question, and it is the one that matters.
Not all water costs the same
Here the footprint reveals its most useful feature. The three colours are not decoration. They tell you what kind of water was used, and the answer changes what the number means.
In the global average for roasted coffee, about 96 percent of the footprint is green water, around 1 percent is blue, and roughly 3 percent is grey. Coffee, in other words, is overwhelmingly a rain fed crop. It grows in the tropics, at altitude, in places where rain is not the scarce thing. The water a coffee tree in the Ethiopian highlands transpires was never going to reach a tap or fill a reservoir. It fell on a hillside, a plant used it, and the plant happened to be coffee rather than forest or grass.
| Kind of water | Share of the global average footprint of roasted coffee |
|---|---|
| Green, rain | about 96% |
| Blue, irrigation | about 1% |
| Grey, pollution | about 3% |
Counting green water is still honest. That land and that rainfall could, in principle, have grown something else. But it is a different kind of cost from pumping a river or an aquifer, and a footprint that is nearly all green describes a crop that is, on the whole, living within its means.
The picture changes where coffee is irrigated. In the Central Highlands of Vietnam, the world's largest producer of robusta, much of the crop is watered through the dry season from wells, and in dry years the groundwater table shows it. There the blue share of the footprint is far above the global average, and the same litre of water carries a different weight. A litre of rain on a wet hillside and a litre pumped from a falling aquifer are counted the same by the method. They are not the same to the people who live downstream.
That is why the footprint is a starting point rather than a verdict. The total says how much. The colours begin to say whose, and from where.
What happens at the mill
Processing is a small share of the footprint, but it is the part of coffee's water story that connects to the rest of this site, and it is the part that treatment engineers tend to know about.
Coffee cherries have to be turned into dry green beans before they can be shipped, and there are two broad ways to do it. In the natural method, the whole cherry is dried in the sun and the fruit is removed afterwards. In the washed method, which produces most of the specialty coffee sold in Europe, the cherry is pulped in water, the sticky layer of fruit around the bean is loosened by fermentation, and the beans are washed clean before drying.
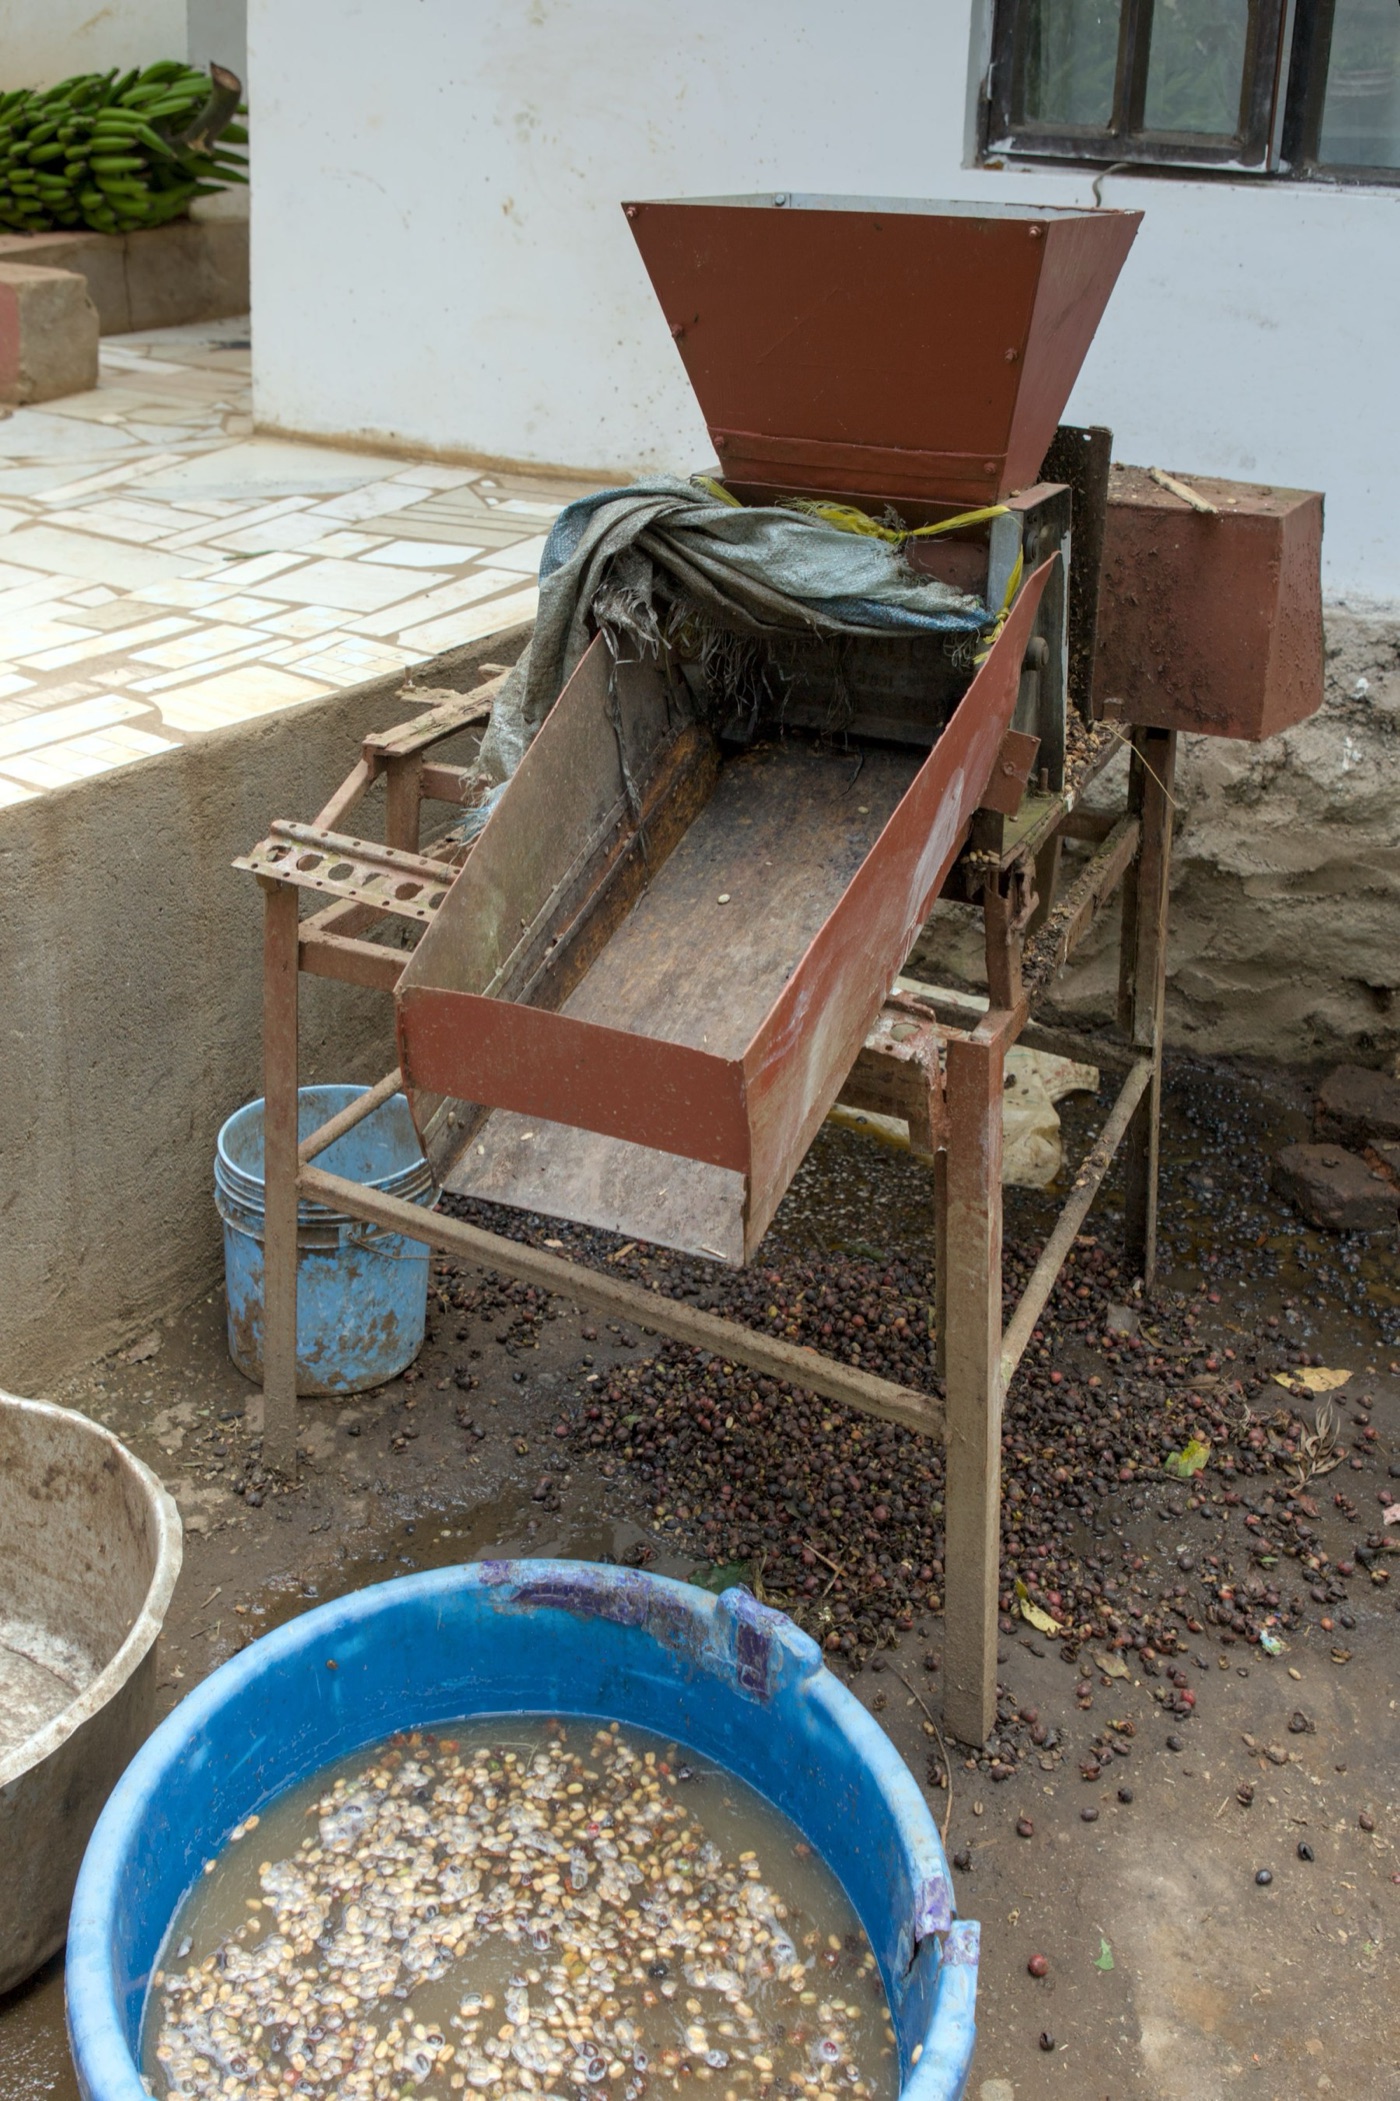
The washing produces a wastewater that a river would recognise as food. It is full of the sugars and pulp stripped from the fruit, and when it reaches a stream, bacteria begin to eat it. As they eat, they consume the oxygen dissolved in the water, and it is that loss of oxygen, rather than anything visibly dirty, that kills fish. The water industry measures this appetite with a figure called chemical oxygen demand, or COD, and coffee mill effluent scores highly on it.
Smaller mills in the coffee belt often discharge this water untreated. Larger ones increasingly do not, and the treatment they use is unglamorous and well understood: a tank to let solids settle, a biological stage where bacteria are given the sugar to eat under controlled conditions, sometimes a pond to finish the job. The water leaves cleaner than it arrived. Nothing about it is difficult. It simply has to be built and run.
The fine print
The 140 litres is a global average, and coffee is a crop with a wide range around its average. A farm on rich volcanic soil with reliable rain and a farm on a dry plain with pumped irrigation can produce indistinguishable cups with very different water behind them. Processing method matters too: a washed coffee uses more water at the mill than a natural one, and disposes of more.
Nor is the number a measure of guilt. Coffee drinkers are sometimes told that giving up the habit would save water, and in the narrowest sense it is true. In any sense that matters, it is not. A cup not drunk in London does not return a drop of rain to an Ethiopian hillside, and the farmer who grew the beans is not better off for the abstention. Where coffee has a water problem, the problem is local, it is about irrigation in dry places, and it is solved by how the crop is grown, not by whether it is bought.
Reading the number properly
What the footprint offers is a way of seeing. It makes visible a quantity that is otherwise invisible by design, because the water in a cup of coffee was used months ago and thousands of kilometres away, by a plant, and returned to the sky. Once it is visible, two questions become possible. How much water was involved, which the footprint answers directly. And whose water it was, whether the place could spare it, which the footprint's three colours begin to answer and which local knowledge has to finish.
Those two questions apply to almost everything in a house. The cotton in a shirt, the wheat in a loaf, the feed behind a glass of milk, the ultrapure water that rinsed the chip inside a phone.

Coffee is a good place to start only because it is small, familiar and made every morning. The counting is the same for all of them, and the rest of this series goes through them one at a time.
Sources
- Water Footprint Network, product gallery: coffee. Method: green, blue and grey water, per the Water Footprint Assessment Manual (Hoekstra et al., 2011).
- Mekonnen, M.M. and Hoekstra, A.Y. (2011). The green, blue and grey water footprint of crops and derived crop products. Hydrology and Earth System Sciences 15, 1577 to 1600. Roasted coffee, global average, with the green, blue and grey split.
- Stage split (growing, processing, brewing) is approximate and illustrative; the per kilo total is the citable figure.
- Photographs: coffee cherries by Brian Smith, US Fish and Wildlife Service (public domain), pulping machine by Harald Ulver (CC BY-SA 4.0), both via Wikimedia Commons; cup by Ante Samarzija, Unsplash.
- Amarasinghe, U.A. et al. (2015). Toward sustainable coffee production in Vietnam: More coffee with less water. Agricultural Systems 136. Dry season irrigation of robusta in the Central Highlands, largely from groundwater.