Thirsty Places: Cape Town
In 2018 a city of four million came within weeks of switching off its taps, and did not. How the drought arrived, what the city did in the last hundred days, what it has built since, and what a near miss taught every other city that watched.
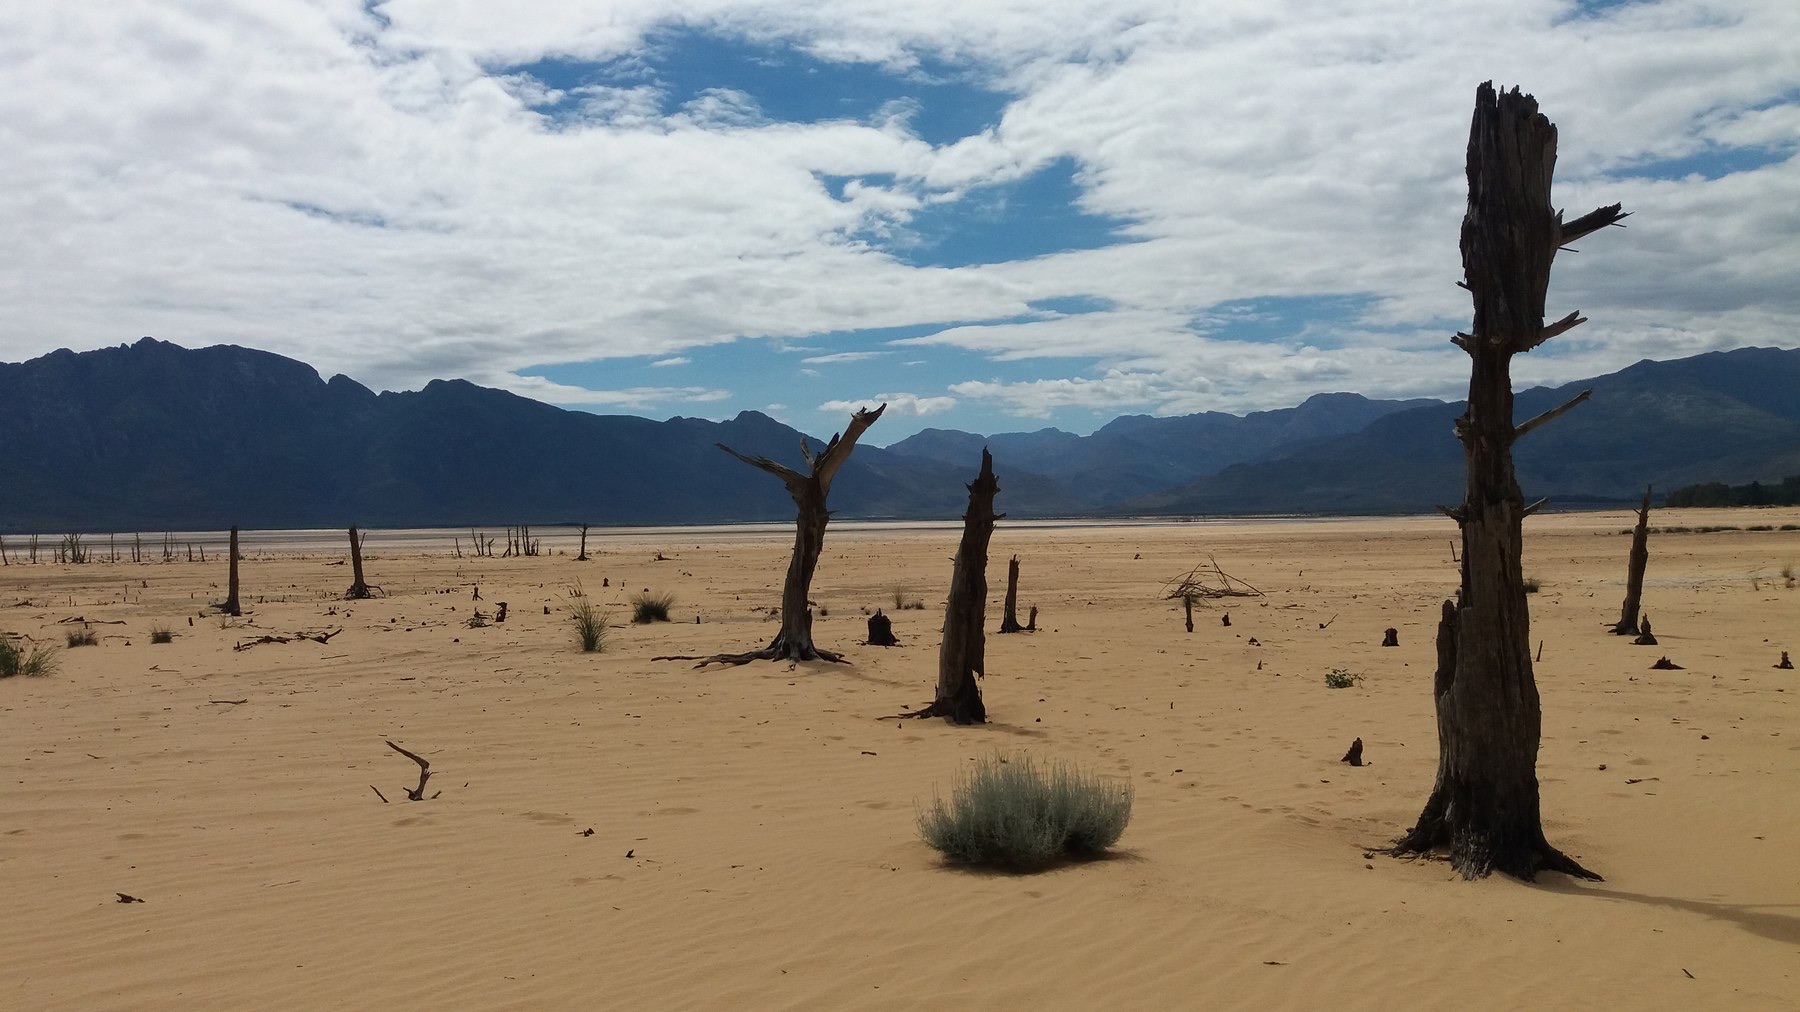
The Theewaterskloof dam, an hour east of Cape Town, holds about half of the city's water when it is full, and in the summer of 2018 it was a plain of cracked mud with a channel of brown water in the middle and the stumps of drowned trees standing up through it. Visitors drove out to photograph it. The photographs, of a reservoir that supplied four million people, went round the world, alongside a phrase the city's mayor had used in January: Day Zero, the day the taps would be turned off.
The day never came. Cape Town is a story about a near miss, which is a rarer and more useful kind of story than a disaster, and this article follows it: how the city got there, what it did in the last hundred days, and what it has built since.
The setting
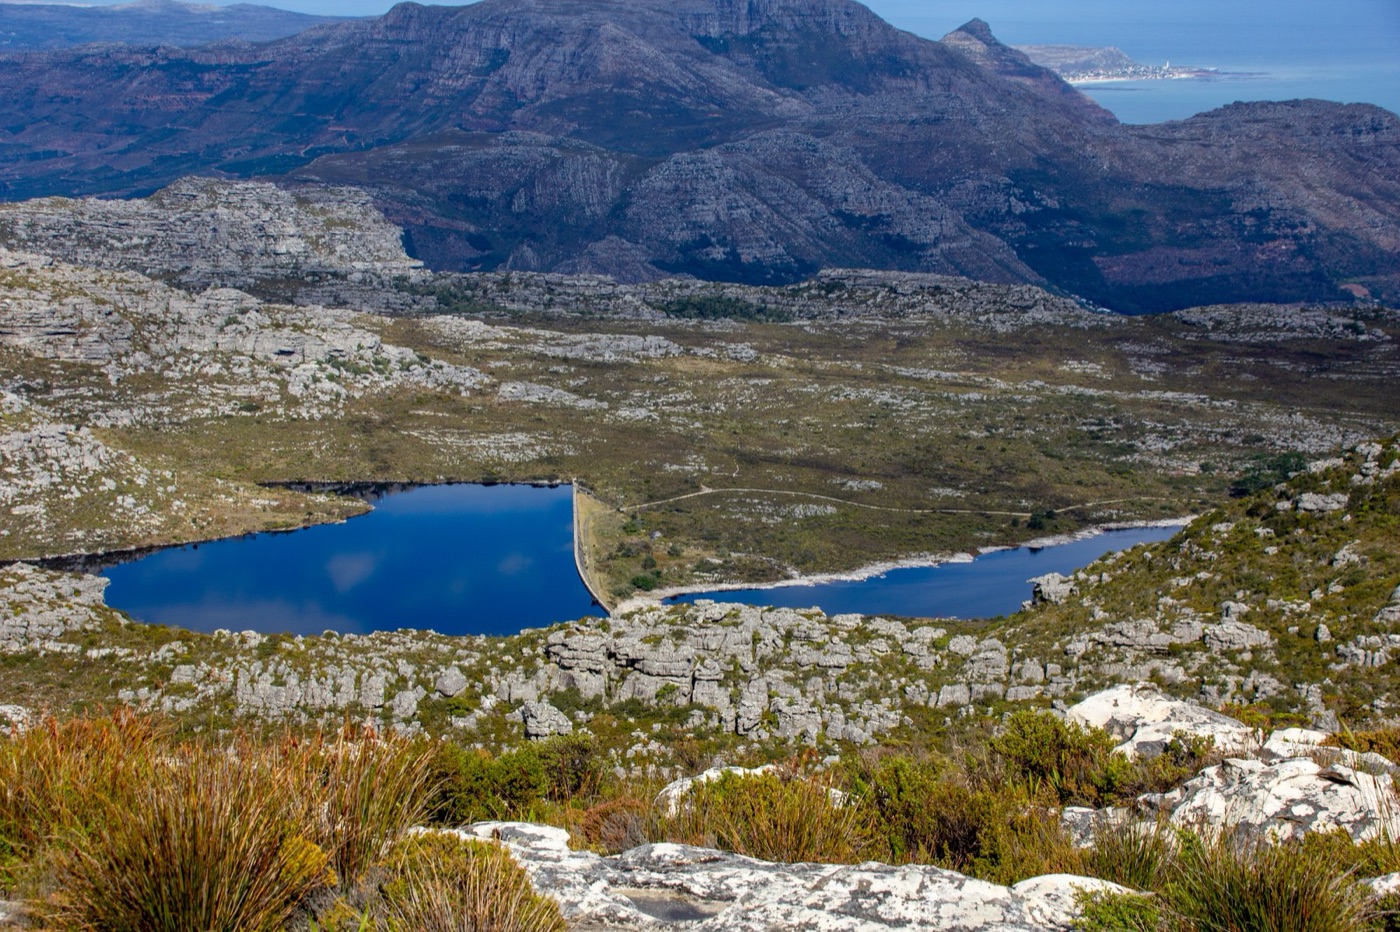
Cape Town has a Mediterranean climate, wet in winter and dry in summer, and it has always lived on winter rain caught in dams in the mountains to its east. The system was built, over a century, to carry the city through two dry years with its normal consumption, and until 2015 it had done so. The city had also grown, from two and a half million people in 1995 to four million, and its consumption had grown with it, while the last large dam had been finished in 2008 and the next was decades away in the plans.
The winter of 2015 was poor. The winter of 2016 was poor again. The winter of 2017 was the driest the catchment had recorded, and an analysis published afterwards found that a warming climate had made a drought of that severity around three times more likely than it would have been a century before. Three winters of deficit took the dams from full to about a fifth by the beginning of 2018.
| The dams that supply Cape Town | Share of capacity |
|---|---|
| Winter 2014, before the drought | Full |
| Early 2016 | About half |
| Early 2017 | About a third |
| Early 2018 | About a fifth |
| The Day Zero threshold | 13.5 percent |
The response, late
The city's response tracked the pattern that every water crisis seems to follow. Through 2015 and 2016 the utility drew down its reserve and asked for voluntary restraint, which achieved a modest cut. Restrictions tightened through 2017 as the dams fell, each level a little stricter than the last, and consumption fell with them, but not fast enough to keep pace with the decline. Only in January 2018, with the dams near a quarter and the rains four months away, did the city announce Day Zero, set the date for April, and impose the Level 6B restrictions that would define the crisis: 50 litres per person per day, punitive tariffs above it, and flow restrictors on the meters of households that exceeded it.
That the strictest measures came in the third year rather than the first is the criticism the city has faced since, and it is fair. It is also, as the article on Day Zero describes, what nearly every city does, because the reserve exists to be drawn down and nobody knows in the first dry year that a third is coming.
The last hundred days
What followed was one of the largest and fastest reductions in urban water use ever recorded, and it was achieved by households rather than by engineering.
The city cut the pressure in its network, so that taps ran slowly and the leaks that every network has lost less. It published its dam levels and the city's consumption every week, on a dashboard that Capetonians checked like a scoreboard, and a map that showed each household's use against its neighbours'. It ran a campaign whose tone was blunt: two minute showers, if it's yellow let it mellow, and a daily count of the litres the city had used against the target of 450 million. It identified the two hundred collection points where water would be distributed if the day came, and the police and army rehearsed them.
Capetonians did the rest. Showers went to two minutes with a bucket at their feet, and the bucket water flushed the toilet. Lawns died. Swimming pools went green and were then emptied. Restaurants served on paper plates and hotels removed the plugs from baths. Households that had used a thousand litres a day used two hundred. The city's consumption, which had been above 1,200 million litres a day in 2015, was around 500 million by February 2018, a cut of more than half. The date moved from April to May, then to June, then, as the winter rain began to fall in earnest, was withdrawn. The dams ended the winter of 2018 at about three quarters full.
| Cape Town's water use | Million litres a day |
|---|---|
| 2015 | Above 1,200 |
| February 2018 | About 500 |
| The target | 450 |
| The saving | More than half, mostly by households |
The spring, and the bill
Two smaller things from the crisis are worth recording, because they say something about how a city behaves near its day.
The first is the spring. In the suburb of Newlands, at the foot of Table Mountain, a natural spring flows from a pipe at the roadside, and in the summer of 2018 it became the most visited place in the city. Queues of cars and people with containers formed from dawn, marshalled by volunteers, and the city eventually built proper collection points and a car park. The water was free, it was clean, and it was outside the restrictions, and people who had never noticed the spring drove across the city for it. Every city near its day has one: a source outside the system that becomes, for a season, the place everyone goes.
The second is the bill. A utility that persuades its customers to halve their consumption halves its revenue, because water is sold by the litre, and Cape Town's water department, having succeeded, found itself unable to pay for the network. The city raised its tariffs sharply in 2018, so that residents paid more for less water at the moment they had done what was asked of them, and the resentment lasted longer than the drought. It is a structural problem of every water utility, that its income depends on the thing it is asking people to use less of, and no city has entirely solved it.
What was built afterwards
A near miss buys a city something a disaster does not, which is time to change while the memory is fresh, and Cape Town used it.
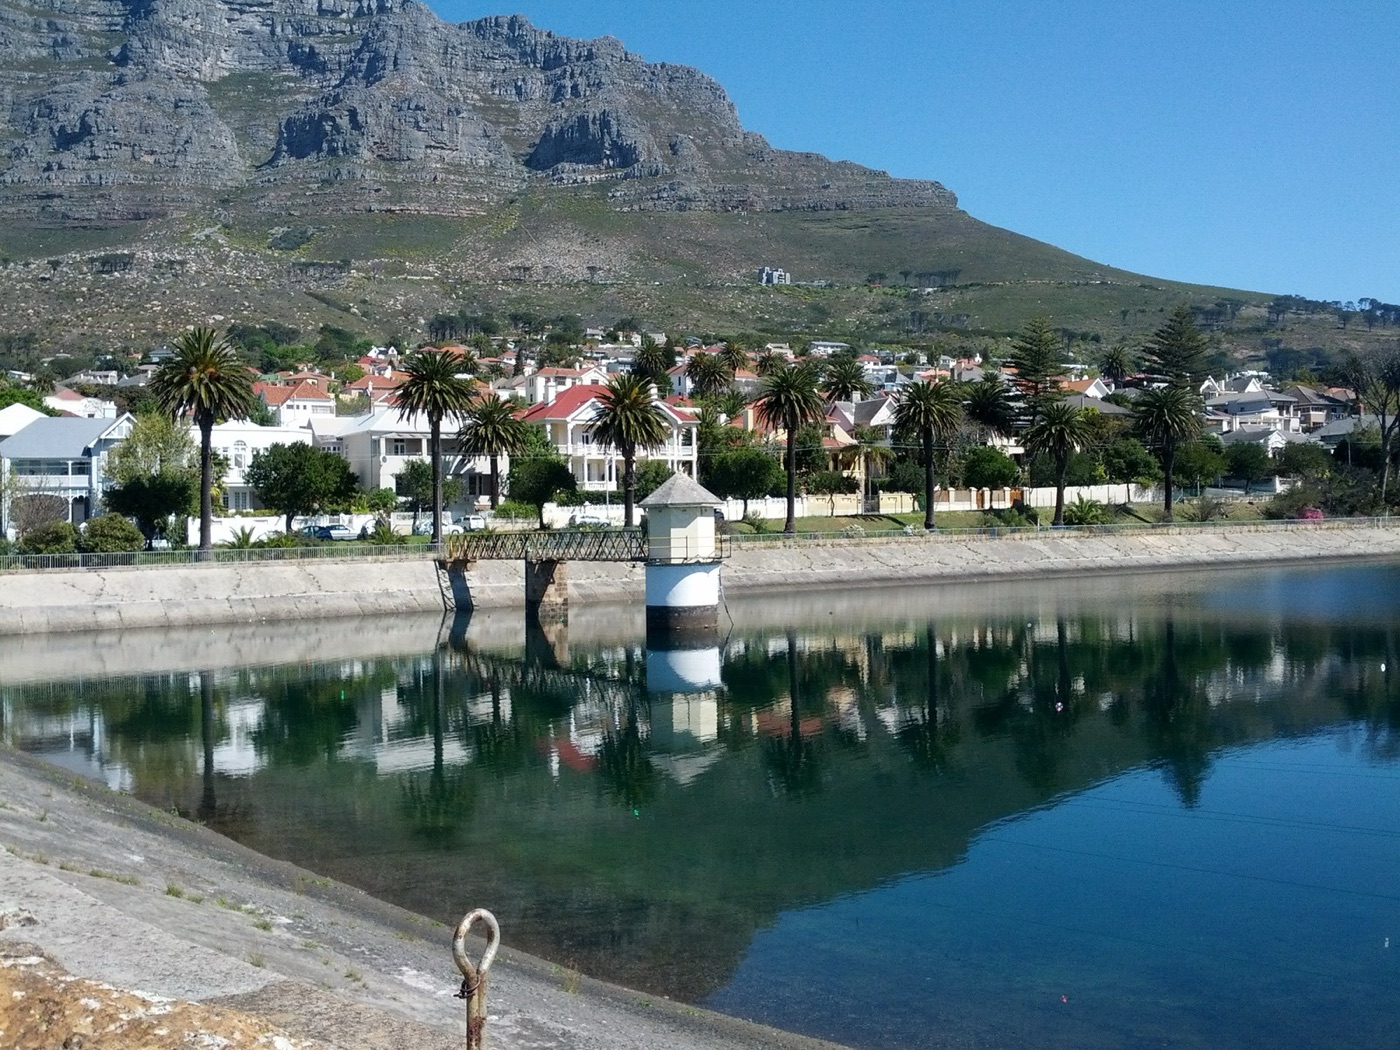
The city's water strategy, published in 2020, rebuilt its planning around a drought of four years rather than two, and around a mix of sources rather than the dams alone. It has drilled into the aquifers under and around the city, the Cape Flats and the Table Mountain Group sandstone, and now takes a meaningful share of its water from the ground, which the drought had shown to be the fastest new source to bring on. It built small emergency desalination plants during the crisis, at the harbour and on the coast, which proved expensive per litre and were mostly shut when the rain returned, and it has argued since about whether to build a large one. It has begun to reuse treated wastewater, first for industry and irrigation and, in its plans, for drinking, along the lines the Singapore article describes. And it has kept the pressure management, the leak repair and the metering, which between them cut the city's losses permanently.
| Cape Town's new water, since 2018 | |
|---|---|
| Groundwater from the Cape Flats and Table Mountain Group aquifers | The largest new source |
| Small desalination plants | Built in the crisis, mostly mothballed since |
| Treated wastewater reuse | Begun for industry and irrigation, planned for drinking |
| Pressure management and leak repair | Permanent |
| Planning horizon | A four year drought rather than two |
What stayed, and what did not
Consumption rose again when the dams refilled, as it always does, but it did not return to where it had been. Cape Town uses substantially less water per person than it did in 2015, several years after the crisis ended, and the difference is partly the fittings that were changed, the low flow shower heads and the dual flush cisterns bought in the panic of 2018, and partly a habit that the city has not entirely shed. People who lived through the buckets and the two minute showers report that they still turn the tap off to brush their teeth. A city that has counted its litres does not quite stop counting.
What it taught the others
Every large city in a dry climate studied Cape Town in 2018, and the lessons they drew are more or less the same three.
Plan for the drought that might come rather than the one that has come before. A reserve for two years is a reserve for the last drought. Act in the first dry year. The restrictions that Cape Town imposed in 2018 would have saved the reserve had they come in 2016, and the same is true of São Paulo, of Chennai and of every city that has approached its own Day Zero. And publish the numbers. The single most effective thing Cape Town did was to tell its citizens, every week, how much water was left and how much they had used, and a public that can see the dam level will do what no bylaw can make it do.
The Theewaterskloof dam has been full more than once since 2018. The stumps of the drowned trees are under water again, and the photographs of the cracked mud are the ones that other cities' water managers keep on their walls.
Sources
- City of Cape Town, Water Outlook 2018 and the Water Strategy (2020). Dam levels, restrictions, the New Water Programme of groundwater, desalination and reuse.
- Muller, M. (2018). Cape Town's drought: don't blame climate change. Nature 559.
- Otto, F.E.L. et al. (2018). Anthropogenic influence on the drivers of the Western Cape drought 2015 to 2017. Environmental Research Letters 13. Climate change made the drought roughly three times more likely.
- Theewaterskloof Dam levels from the South African Department of Water and Sanitation.
- Photographs: opener, Theewaterskloof sandscape 2018-03-11 by Zaian (CC BY-SA) via Wikimedia Commons; inline: Table Mountain, Cape Town (MP) 2018 106 by Photograph by Mike Peel (www.mikepeel.ne (CC BY-SA) via Wikimedia Commons; inline: Molteno Dam-002 by magemu (CC BY-SA) via Wikimedia Commons.