Plain Water: Leaks
About a third of the water that the world's utilities treat and pump never reaches a customer. It leaks from cracked mains, runs from broken pipes under the street, and is stolen or unmetered. The industry calls it non revenue water, and it is the largest source of new water in almost every city, already treated, already pumped, and lost within the city's own pipes.
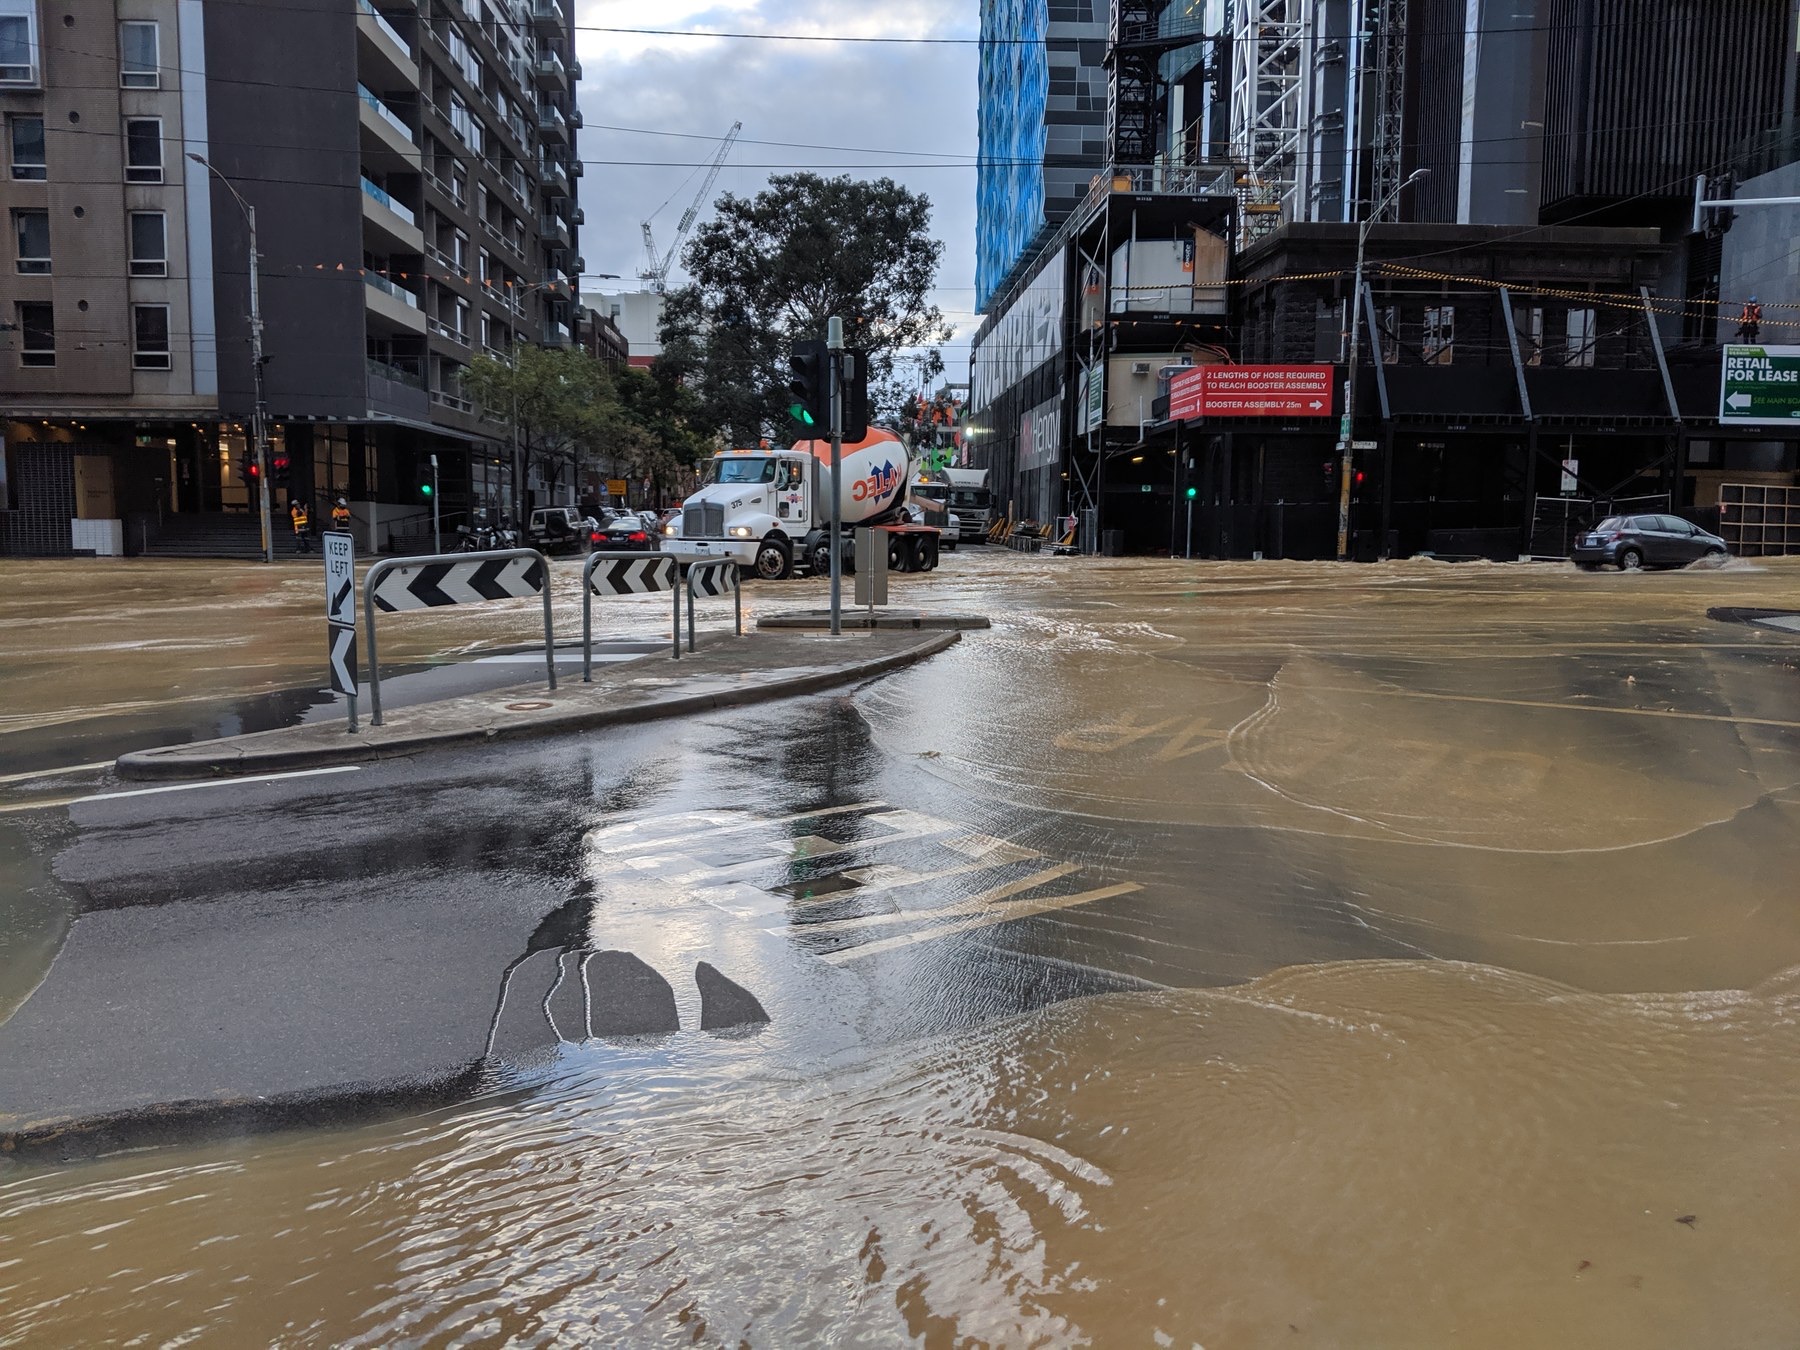
Under every city street there is a pipe, and the pipe is leaking. Sometimes it is obvious, a fountain in the road after a main bursts and a crew with a digger by nightfall. Mostly it is invisible: a hairline crack in a cast iron main laid in 1890, a joint that has shifted a millimetre in a century of traffic, a service pipe corroded through under a garden, each losing a few litres a minute into the soil, for years, unseen. Add up every one of those in every city, and the world's water utilities lose about a third of the water they produce before it reaches a customer.
This article is about that third. The industry calls it non revenue water, an accountant's phrase for water that was treated, pumped and never paid for, and it is, in almost every city on Earth, the largest and cheapest source of new water there is.
The water balance
A utility knows how much water it puts into its network, because it meters the plants and the pumping stations. It knows how much it bills, because it meters the customers. The difference is non revenue water, and the standard way of accounting for it, developed by the International Water Association, breaks the difference into pieces.
| Where the missing water goes | |
|---|---|
| Real losses | Leaks from mains, joints, service pipes and reservoirs |
| Apparent losses | Water used but not measured: illegal connections, meters that under read, billing errors |
| Unbilled authorised use | Fire fighting, flushing mains, public fountains |
| Non revenue water | All three together |
The distinction between real and apparent losses matters, because they are fixed differently. Real losses are engineering: the water is in the ground. Apparent losses are money: the water reached someone, and the utility was not paid for it. A city with high apparent losses has a governance problem. A city with high real losses has old pipes. Most cities have both.
The number
A study in 2019 gathered what utilities report and estimated the world's non revenue water at about 126 billion cubic metres a year, close to a third of all the water put into networks, worth about 39 billion dollars at the utilities' own prices. The figure is imprecise, because the utilities that lose most report least, and it is almost certainly low.
The range behind the average is the interesting part.
| Non revenue water, examples | Share of water supplied |
|---|---|
| Denmark, national average | Under 10 percent |
| Tokyo | About 3 percent |
| Singapore | About 5 percent |
| Germany | Under 10 percent |
| London, Thames Water | Around 25 percent |
| Italy, national average | Over 40 percent |
| Mexico City | About 40 percent |
| Many cities in South Asia and Africa | 40 to 60 percent |
The cities near the top share a habit: they measure every district, they hunt leaks continuously, and they replace pipes before they fail. The cities near the bottom share the opposite, and, in several of them, a supply that is intermittent, a few hours a day, which is the single most destructive thing that can be done to a pipe network. A main that is filled and emptied daily is a main whose joints are worked loose and whose empty hours suck dirty groundwater in through the same cracks the clean water leaks out of. Chennai and Mexico City, in their own articles, both have it. The cure for both the leaks and the contamination is the same, which is to keep the pipes full.
Why pipes leak
Pipes leak because they are old, because they move, and because they are under pressure.
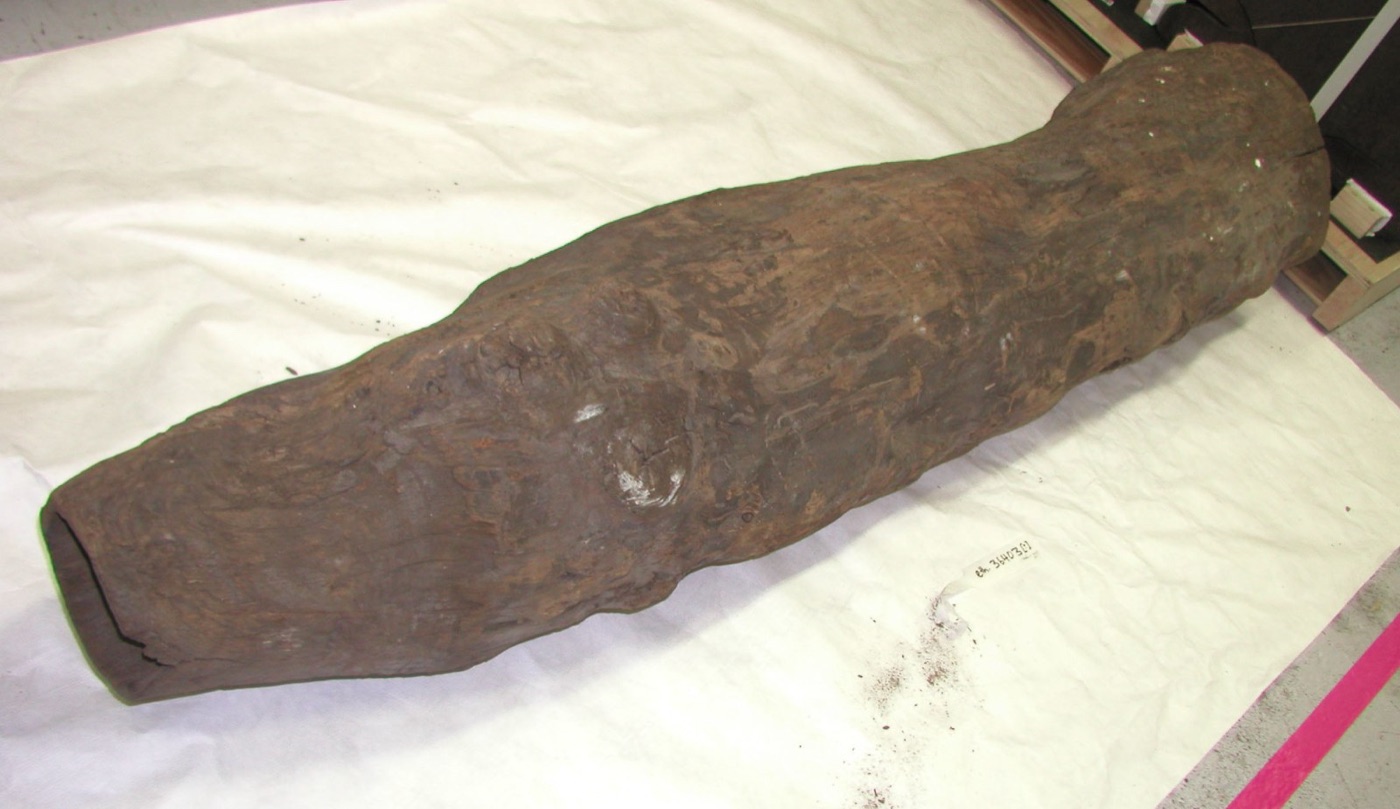
Age is the obvious one. Much of the water network of the industrialised world was laid between 1850 and 1950, in cast iron and later in asbestos cement and steel, and it is at the end of its life. London's mains average well over a century old, and a share of them are the Victorian originals. Replacing a kilometre of main under a city street costs on the order of a million dollars, and a large utility has tens of thousands of kilometres. At the rates most utilities replace pipe, the network turns over every two to three hundred years.
Movement is the quiet one. Ground shifts, from traffic, from frost, from drought shrinking clay soils, and, in the sinking cities of the Mexico City and Jakarta articles, from subsidence, which breaks pipes faster than any crew can mend them. A network laid in ground that moves by tens of centimetres a year cannot be kept tight.
Pressure is the one the industry has learned to manage. Water leaks in proportion to the pressure behind it, and a network run at high pressure to reach the top of the hill loses far more from every crack than one run at the minimum needed. Dividing a city into zones and controlling the pressure in each, especially at night when demand is low and pressure rises, is the cheapest leak reduction there is, and it is also the reason the taps in a well run city run gently rather than at a blast.
Finding them
A leak of a litre a minute under a road makes no puddle. Finding it is a craft, and the craft has three parts.
The first is the district. A utility divides its network into areas of a few thousand connections, each fed through a single metered pipe, and it watches the flow into each district in the small hours, when almost nobody is using water. The night flow is the leakage, near enough, and a district whose night flow rises has a new leak. Cities that have done this, which is every city in the top rows of the table above, can point to a leak within days of its starting.
The second is listening. Water escaping through a crack under pressure makes a sound, a hiss transmitted along the pipe, and a technician with a listening stick on the valves and hydrants, or a set of correlating sensors clamped to the main at two points, can place it to within a metre. The night walker with a rod to their ear is still, in most cities, the person who finds the leaks. Permanent acoustic sensors, left on the network and reporting by radio, are the same idea automated.
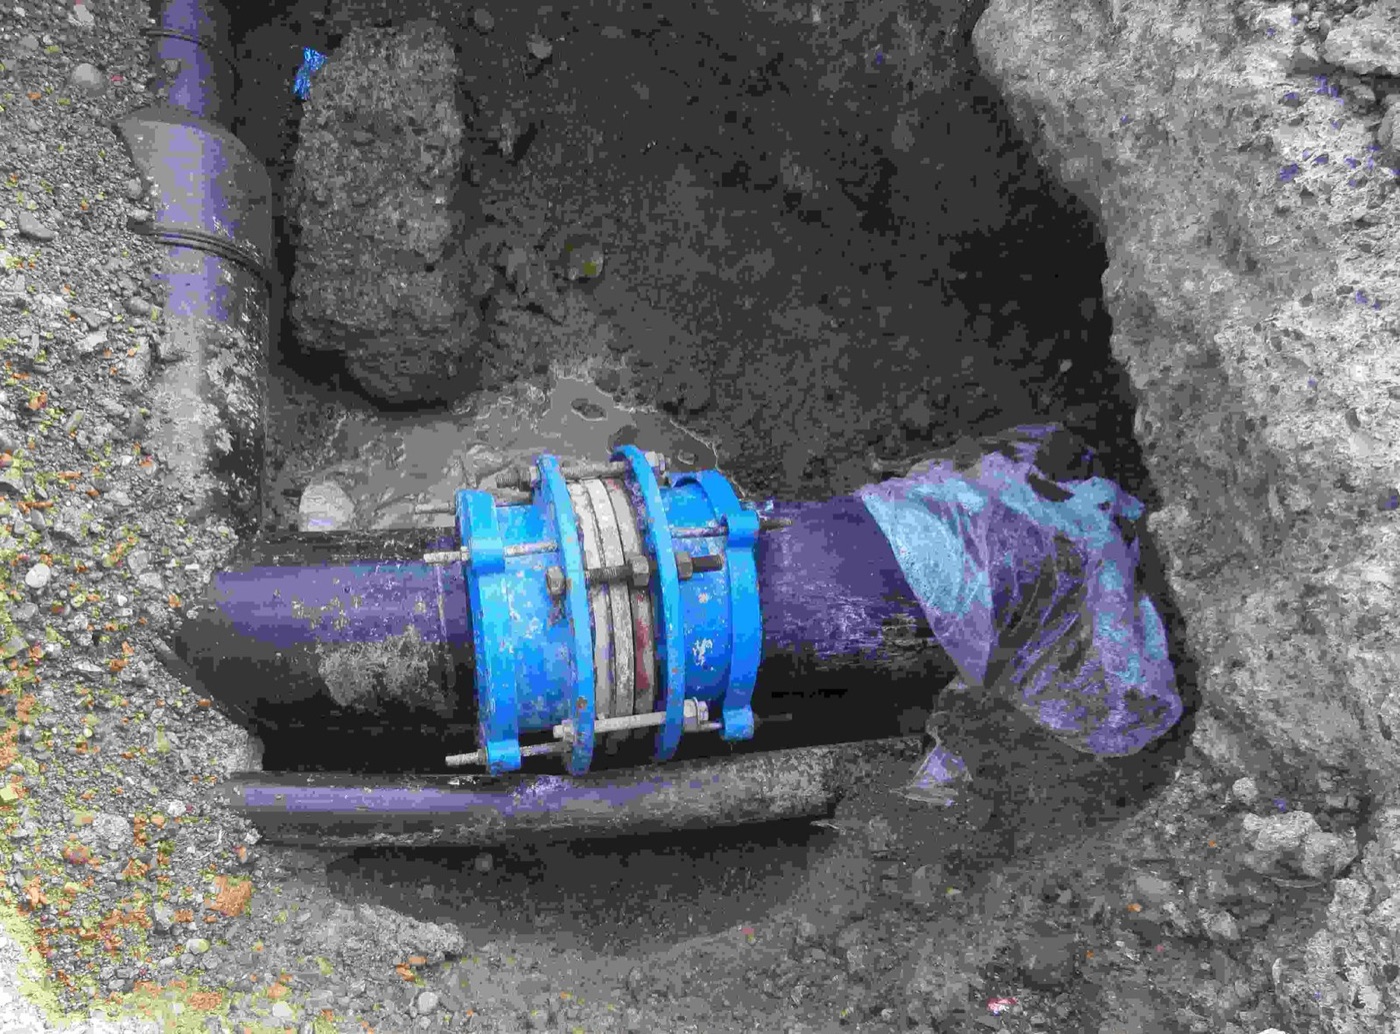
The third is replacement. A leak found is a hole dug and a pipe mended, and a main that has been mended a dozen times is a main that should be replaced. The utilities with the lowest losses are the ones that replace pipe on a schedule, at one or two percent of the network a year, before it fails.
The other losses
Apparent losses, the water that reached someone and was not paid for, deserve a paragraph, because in many cities they are the larger half. A household meter slows as it ages and under reads by a few percent, and a utility with a million old meters is losing a few percent of its revenue to arithmetic. An illegal connection, a pipe tapped into the main before the meter, is theft in the eyes of the utility and, in the informal settlements of many cities, the only supply there is. Utilities that have gone after apparent losses have replaced their meters on a cycle, legalised the informal connections by installing meters and charging a tariff people can pay, and audited their billing, and they have found revenue that pays for the leak crews. The two halves of non revenue water fund each other, which is why the better utilities attack both.
Tokyo
The city that shows what is possible is Tokyo. In the 1950s its waterworks lost more than a fifth of its water, in a network shattered by the war and the earthquakes before it. Over sixty years the utility replaced its mains with ductile iron and earthquake resistant joints, replaced every lead service pipe, divided the city into monitored districts, put listening crews on the streets every night, and repaired leaks within a day of finding them. Its leakage rate is now about three percent, the lowest of any large city in the world, and the water it saved, on the order of a hundred million cubic metres a year, is a supply the city never had to find. Singapore, with a smaller network and the same discipline, is at five.
Neither city did anything exotic. They measured, they listened, they dug, and they kept doing it, for decades, and they paid for it out of the water bill.
The cheapest water there is
The reason leaks belong on this site, alongside desalination plants and reuse schemes, is arithmetic. A cubic metre of leaked water was already drawn, treated, pumped and pressurised, at the utility's full cost. Recovering it costs the price of finding and fixing the leak, and no more. In most cities that is cheaper than any new source, cheaper than a new well, far cheaper than desalination, and it is available at once. A city losing 40 percent that gets to 20 has found a quarter more water without touching a river. Cape Town, in its Day Zero year, cut pressure across the city and found tens of millions of litres a day in its own pipes. Chennai and Mexico City, which lose a third to two fifths, have, in their leaks, a supply larger than their desalination plants.
It is unglamorous. Nobody opens a mended pipe with a ribbon. And it is, for most of the world's cities, the largest source of new water they will ever have.
What it teaches
Water that leaks is the purest waste on this site: it was clean, it was delivered, and it went into the ground under the street a hundred metres from the tap it was meant for. The cities that have chased it have found that the chase pays, indefinitely, and the ones that have not are building plants to replace water they already had. Anyone judging a utility should ask, before anything else, what share of its water it loses and whether the number is falling. It is the question that predicts the rest.
A third of the world's supply, and a hiss under the road at night.
Sources
- Liemberger, R. and Wyatt, A. (2019). Quantifying the global non revenue water problem. Water Supply 19. About 126 billion cubic metres a year, worth about 39 billion dollars.
- International Water Association, Water Loss Specialist Group: the standard water balance and the Infrastructure Leakage Index.
- Tokyo Metropolitan Government Bureau of Waterworks: leakage rate reduced from over 20 percent in the 1950s to about 3 percent.
- Ofwat and Thames Water, annual performance reports on leakage in London.
- World Bank (2006). The Challenge of Reducing Non Revenue Water in Developing Countries. Kingdom, Liemberger and Marin.
- Photographs: opener: Burst Water Main in Melbourne July 2019 by Nickw25 (CC BY-SA) via Wikimedia Commons; inline: Pipe, water (AM 68284) by Unknown authorUnknown author (CC BY) via Wikimedia Commons; inline: BCA pipe repair 2 in Cabacú by Sarang (public domain) via Wikimedia Commons.