Plain Water: pH
The number everyone half remembers from school is the one a water operator checks first and adjusts most often. What pH measures, why the scale is stranger than it looks, what it does to fish, pipes and bacteria, and how one city's failure to manage it poisoned its own water supply.
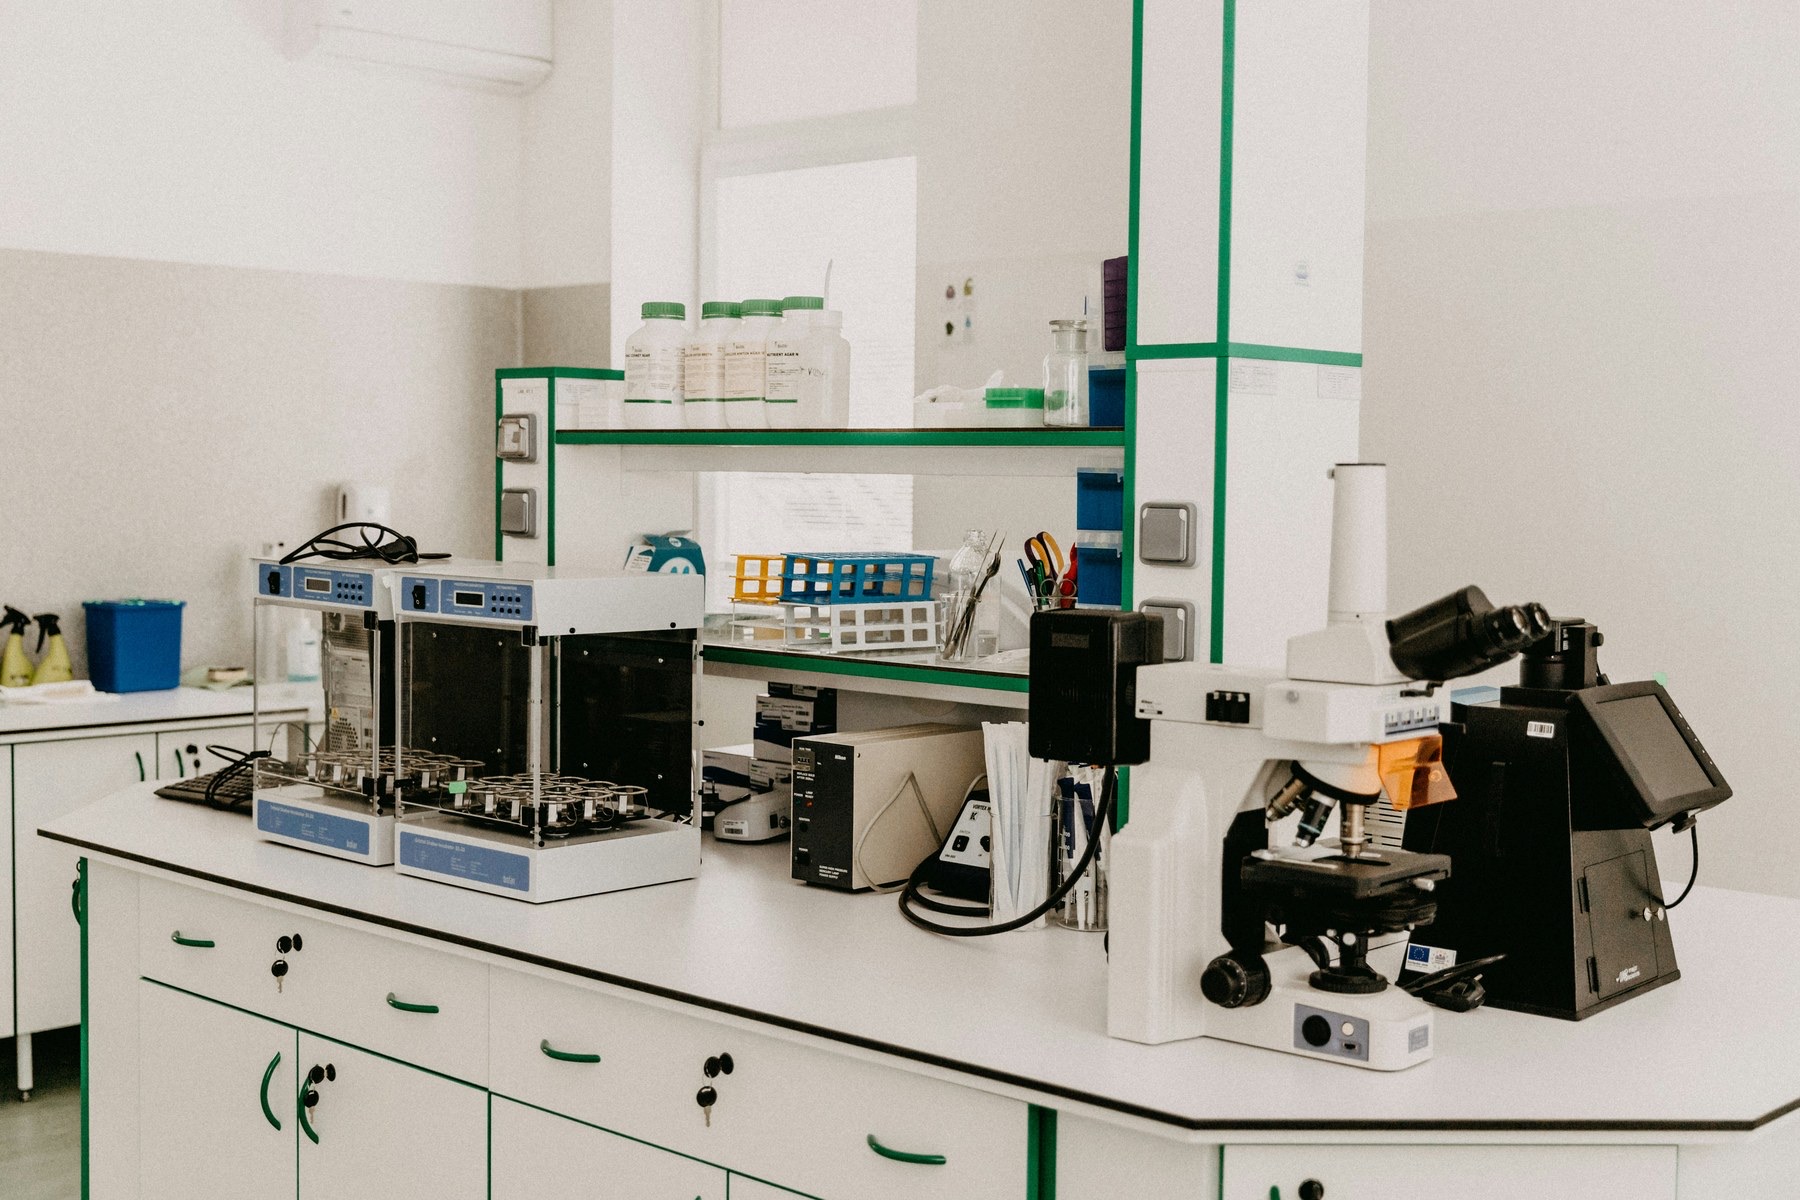
Every water laboratory has a pH meter, and it is the instrument that is used most and thought about least. The operator dips the probe, reads a number between 6 and 9, and moves on, and if the number is outside that band the day changes. pH is the first thing checked on an incoming effluent, the first thing adjusted before the biology tank, and the thing that, when a city gets it wrong, can poison a water supply without anyone noticing for a year.
This article is about what the number means, why the scale behaves as it does, and what pH decides in a river, a treatment plant and a pipe.
What it measures
pH measures how acid or alkaline water is, and it does so by counting hydrogen ions. Pure water splits, very slightly, into hydrogen ions and hydroxide ions in equal numbers, and that balance is neutral, pH 7. Add an acid and hydrogen ions outnumber hydroxide; the pH falls. Add an alkali, and the reverse; it rises. The scale runs from 0 to 14, and the p in the name is a mathematical operation that turns an awkward tiny concentration into a convenient small number.
The consequence of that operation is the thing most people never learned. The scale is logarithmic. Each unit is a tenfold change. Water at pH 5 is ten times more acid than water at pH 6, and a hundred times more acid than at 7. A change from 8 to 6, which looks like a small drift on a chart, is a hundredfold increase in acidity, and living things notice it.
| Water | pH |
|---|---|
| Acid mine drainage | 2 to 3 |
| Lemon juice, for comparison | About 2 |
| Rain, from dissolved carbon dioxide | About 5.6 |
| A soft upland river | 6 to 7 |
| Drinking water, the recommended range | 6.5 to 8.5 |
| Seawater | About 8.1 |
| A chalk stream or a limestone river | 8 to 8.5 |
| Textile effluent at the pipe | 9 to 11 |
| Caustic soda solution | 13 to 14 |
Rain is naturally slightly acid, at about 5.6, because carbon dioxide from the air dissolves in it as a weak acid; acid rain, from sulphur and nitrogen oxides, goes lower. The sea is slightly alkaline and buffered, which is why the fall in its pH from about 8.2 to 8.1 over the industrial era, small on the scale, is a large change in its chemistry.
How it is measured, and where the scale came from
The pH scale was invented in 1909 by Søren Sørensen, a chemist at the Carlsberg Laboratory in Copenhagen, who needed a convenient way to describe the acidity of the solutions he was using to study proteins and the brewing of beer. The scale that every water operator uses was, at its origin, a brewer's tool, which readers of the beer article on this site may find fitting.
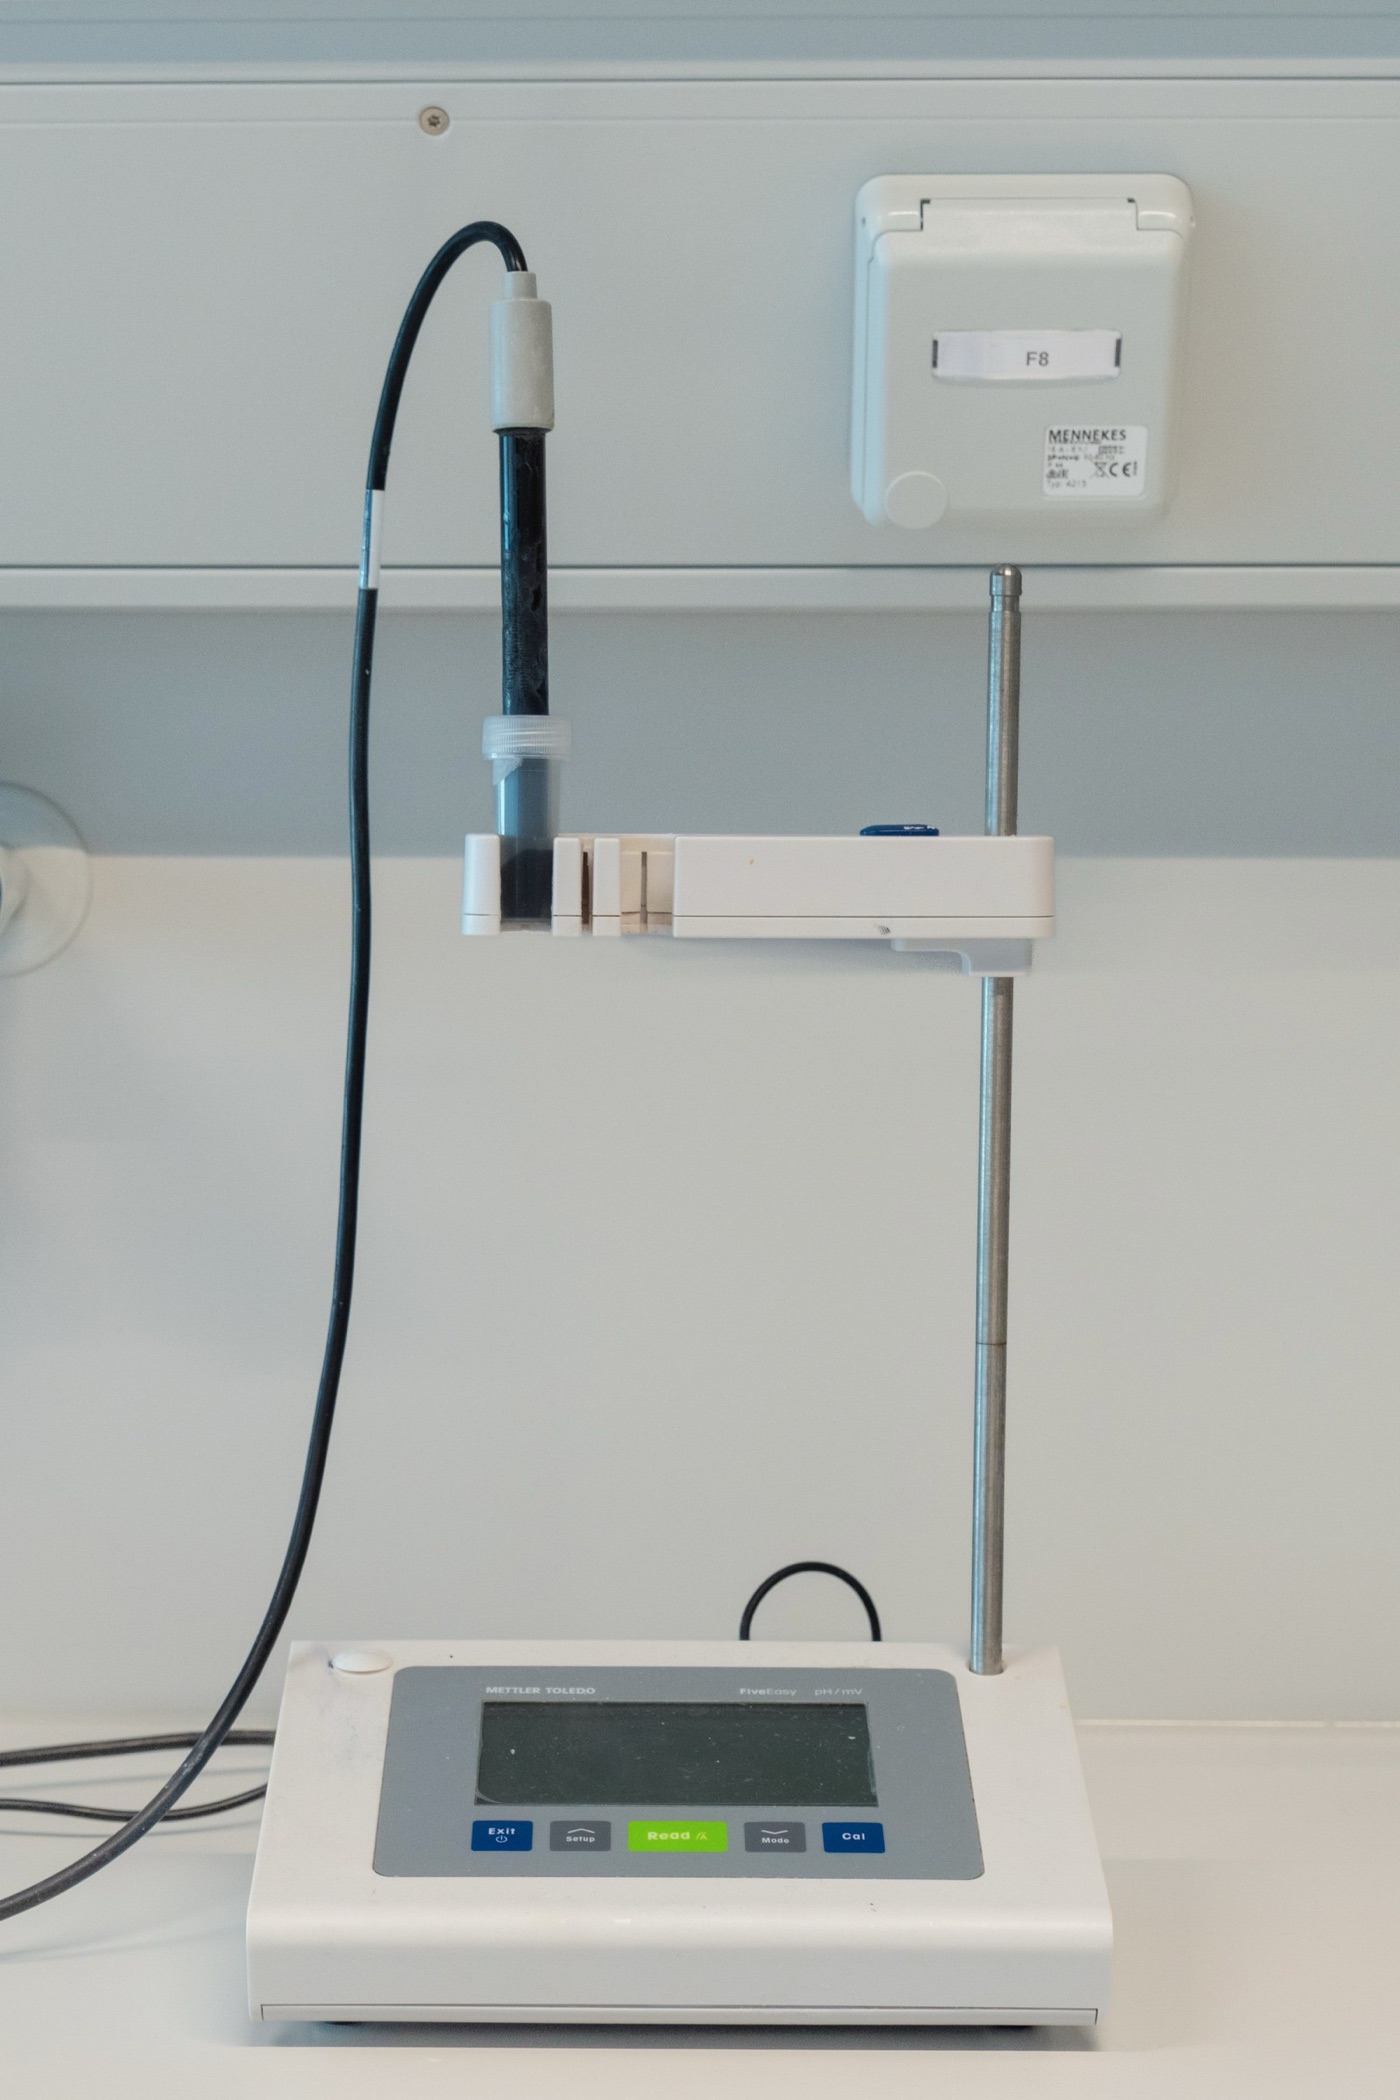
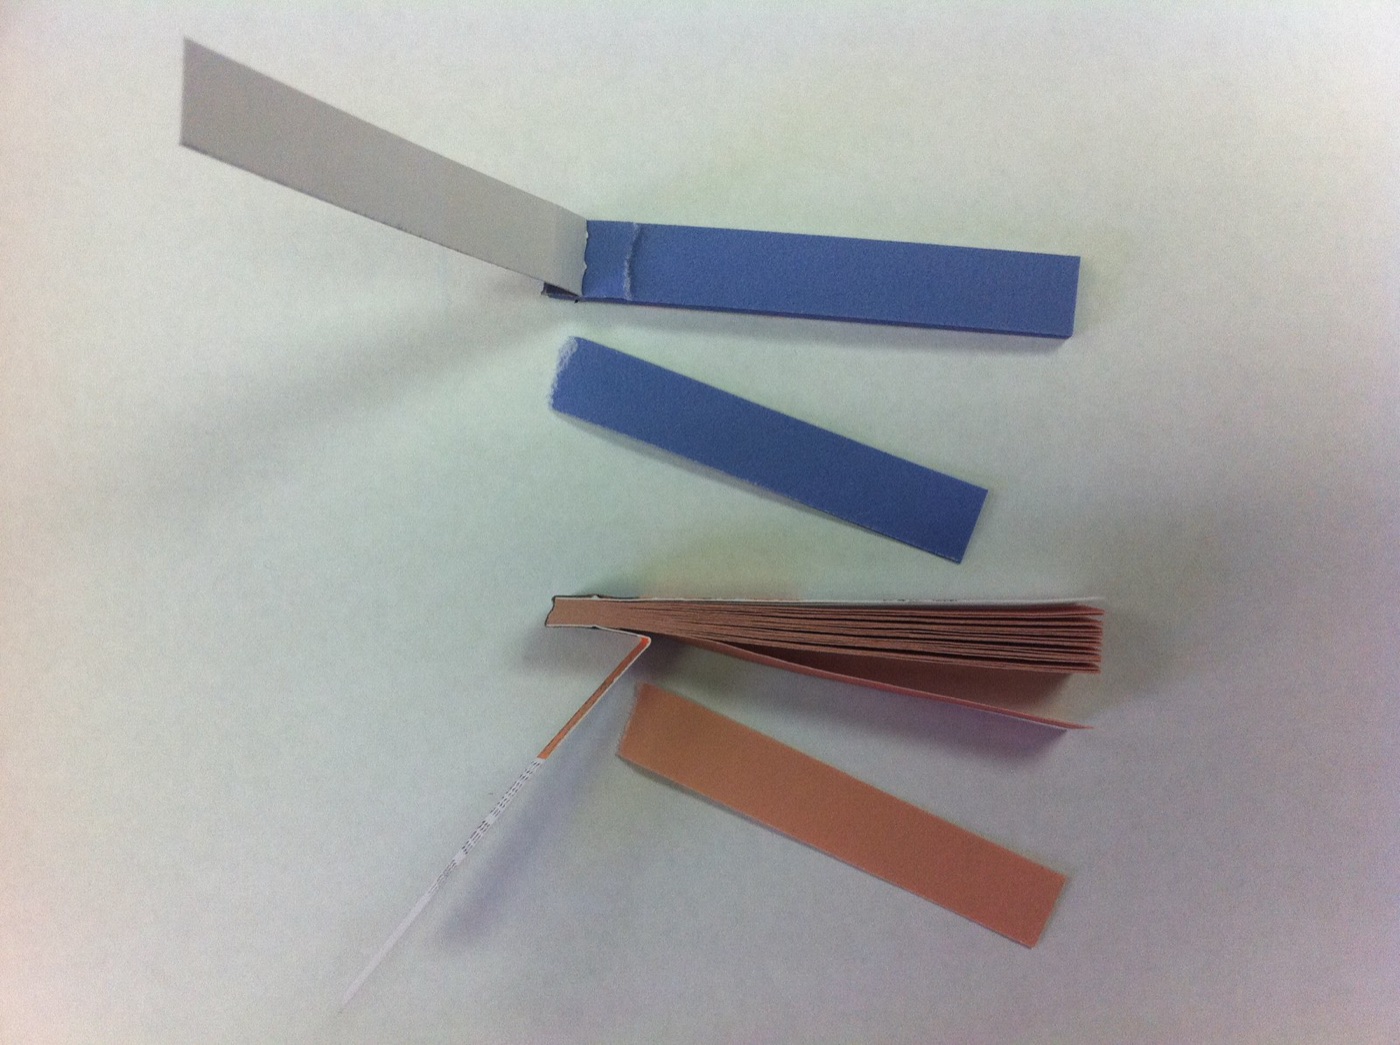
It is measured in two ways. The old way is a dye that changes colour with acidity, litmus in the schoolroom and more precise indicators in the laboratory, dried onto paper or added as drops. The modern way is a glass electrode: a probe with a thin glass bulb at its tip, across which a voltage develops that depends on the hydrogen ions in the water. A meter reads the voltage and reports the pH, in a second, to a hundredth of a unit. The electrode has to be calibrated against buffer solutions of known pH before use, and it drifts, dries out and ages, so the operator's first job of the day is to check it against the buffers. A plant that dosed acid on a probe that had drifted by half a unit would be dosing five times too much or too little, and the drift is the commonest cause of a plant's chemistry going wrong.
What it does to fish
A river's life is adapted to its pH, and the tolerance is narrow. Most freshwater fish are comfortable between about 6.5 and 8.5, stressed outside it, and killed below about 4.5 or above about 9.5, in both cases because the water attacks their gills. The famous acidified lakes of Scandinavia and Canada, in the decades of acid rain, lost their fish at pH values around 5, and the limestone that was spread on them by helicopter was pH treatment on the scale of a landscape.
Two things make pH more dangerous than it looks. The first is the logarithm: a discharge that moves a river by one unit has changed its acidity tenfold. The second is what pH does to everything else. Metals that are safely locked in sediment at pH 7 dissolve at pH 5 and become toxic. Ammonia, which is present in every treated effluent, is mostly harmless as the ammonium ion at neutral pH and becomes the toxic free ammonia gas as the pH rises above 8. A river that is warm and alkaline downstream of a sewage works can kill fish with an ammonia concentration that would be harmless in cool acid water, and the pH is the reason.
What it does in a treatment plant
Inside a plant, pH is the number that decides whether the chemistry and the biology will work at all, and it is adjusted more often than any other.
The bacteria in the activated sludge tank, described in the ETP article, eat within a band of roughly 6.5 to 8.5 and stop outside it. A dye house's effluent arrives at 10 or 11, hot with caustic from the scouring and dyeing baths, and it would sterilise the biology tank in an hour. So the first thing the plant does is neutralise it, usually with sulphuric acid dosed by a controller that reads a pH probe continuously. A food plant's effluent can arrive acid, from fruit or from cleaning, and is neutralised the other way, with lime or caustic soda.
The bacteria also change the pH themselves. The ones that convert ammonia to nitrate produce acid as they do it, and a plant that removes a great deal of ammonia can drift down until the process stalls, so operators watch the alkalinity, the water's capacity to absorb acid, and add lime when it runs low.
Coagulation, the chemical step that removes colour and fine solids by making them clump, works only in a window. Aluminium sulphate, the commonest coagulant, forms its clumping floc between about pH 6 and 7 and dissolves again outside it; iron salts have a wider window. A plant that doses coagulant at the wrong pH wastes the chemical and clouds the water. And disinfection with chlorine is far more effective at lower pH, because the active form of chlorine changes with it, which is why the recommended drinking water range stops at 8.5.
| Where pH decides the process | The window | What happens outside it |
|---|---|---|
| Activated sludge biology | About 6.5 to 8.5 | Bacteria stop eating; the plant fails |
| Nitrification | Consumes alkalinity | pH drifts down until it stalls |
| Coagulation with alum | About 6 to 7 | Floc dissolves; colour stays |
| Chlorine disinfection | Better below 8 | Chlorine is far less effective |
| Discharge permit | Usually 6 to 9 | Prosecution |
What it does to pipes
The last thing pH decides is what water does to the pipe it flows through, and this is where it left the laboratory and made headlines.
Water that is slightly acid, or that carries little dissolved mineral, dissolves what it meets, and in an old network what it meets is iron, copper and lead. Water utilities in soft or acid water regions know this and treat for it: they raise the pH with lime, or dose orthophosphate, a chemical that forms a thin protective film on the inside of pipes so that the water never touches the metal. The film is invisible, cheap to maintain and easy to destroy.
In April 2014 the city of Flint, Michigan, switched its water supply from Detroit's treated Lake Huron water to the Flint River, to save money. The river water was more corrosive, and the city did not add corrosion control. Over the following months the protective film inside the network's lead pipes dissolved, and lead entered the water in the homes of a hundred thousand people. Blood lead levels in the city's children roughly doubled. Residents complained about the water's colour and taste for over a year before the cause was acknowledged, and the city switched back in October 2015. The chemistry was never obscure. It was a matter of pH, alkalinity and a phosphate dose that any water chemist would have specified, and it was not done.
The ocean, briefly
The one place where a small change in pH has become a global question is the sea. The oceans absorb a large share of the carbon dioxide that people release, and dissolved carbon dioxide is a weak acid, so the surface ocean's pH has fallen from about 8.2 to about 8.1 since the industrial era began. A tenth of a unit sounds like nothing, and on the logarithmic scale it is an increase in acidity of around 30 percent, enough to change the chemistry by which corals, shellfish and plankton build their shells from dissolved carbonate. The sea is buffered, which is why the change is slow, and it is very large, which is why nothing can be done about it locally. It is the same number as the one on the laboratory bench, measured on the largest body of water there is.
Reading the number
pH is the cheapest measurement in the water business and among the most consequential. It is read in a second by a probe that costs less than a phone, and it decides whether fish live, whether bacteria eat, whether coagulants clump, whether chlorine works and whether pipes stay lined. The recommended range for drinking water, 6.5 to 8.5, is not a health limit, because water at pH 6 or 9 does no direct harm to the person drinking it. It is the range within which everything else about the water behaves, and the operator who checks it first has learned that the hard way.
Sources
- World Health Organization, Guidelines for Drinking water Quality, pH: no health based guideline; an operational range of 6.5 to 8.5 recommended for corrosion control and disinfection efficiency.
- Council Directive 91/271/EEC and typical discharge permits: effluent pH limits commonly 6 to 9.
- Metcalf and Eddy, Wastewater Engineering. pH ranges for activated sludge (about 6.5 to 8.5), nitrification and coagulation; alkalinity consumption.
- Hanna Attisha, M. et al. (2016). Elevated blood lead levels in children associated with the Flint drinking water crisis. American Journal of Public Health 106. The 2014 switch to the Flint River without corrosion control.
- Photographs: Cesar Chu Ortega, from water laboratories in India and Bangladesh; inline: PH-Meter METTLER TOLEDO FiveEasy by OER CampLev (CC BY-SA) via Wikimedia Commons; inline: Blue and red litmus paper by Meganbeckett27 (CC BY-SA) via Wikimedia Commons.