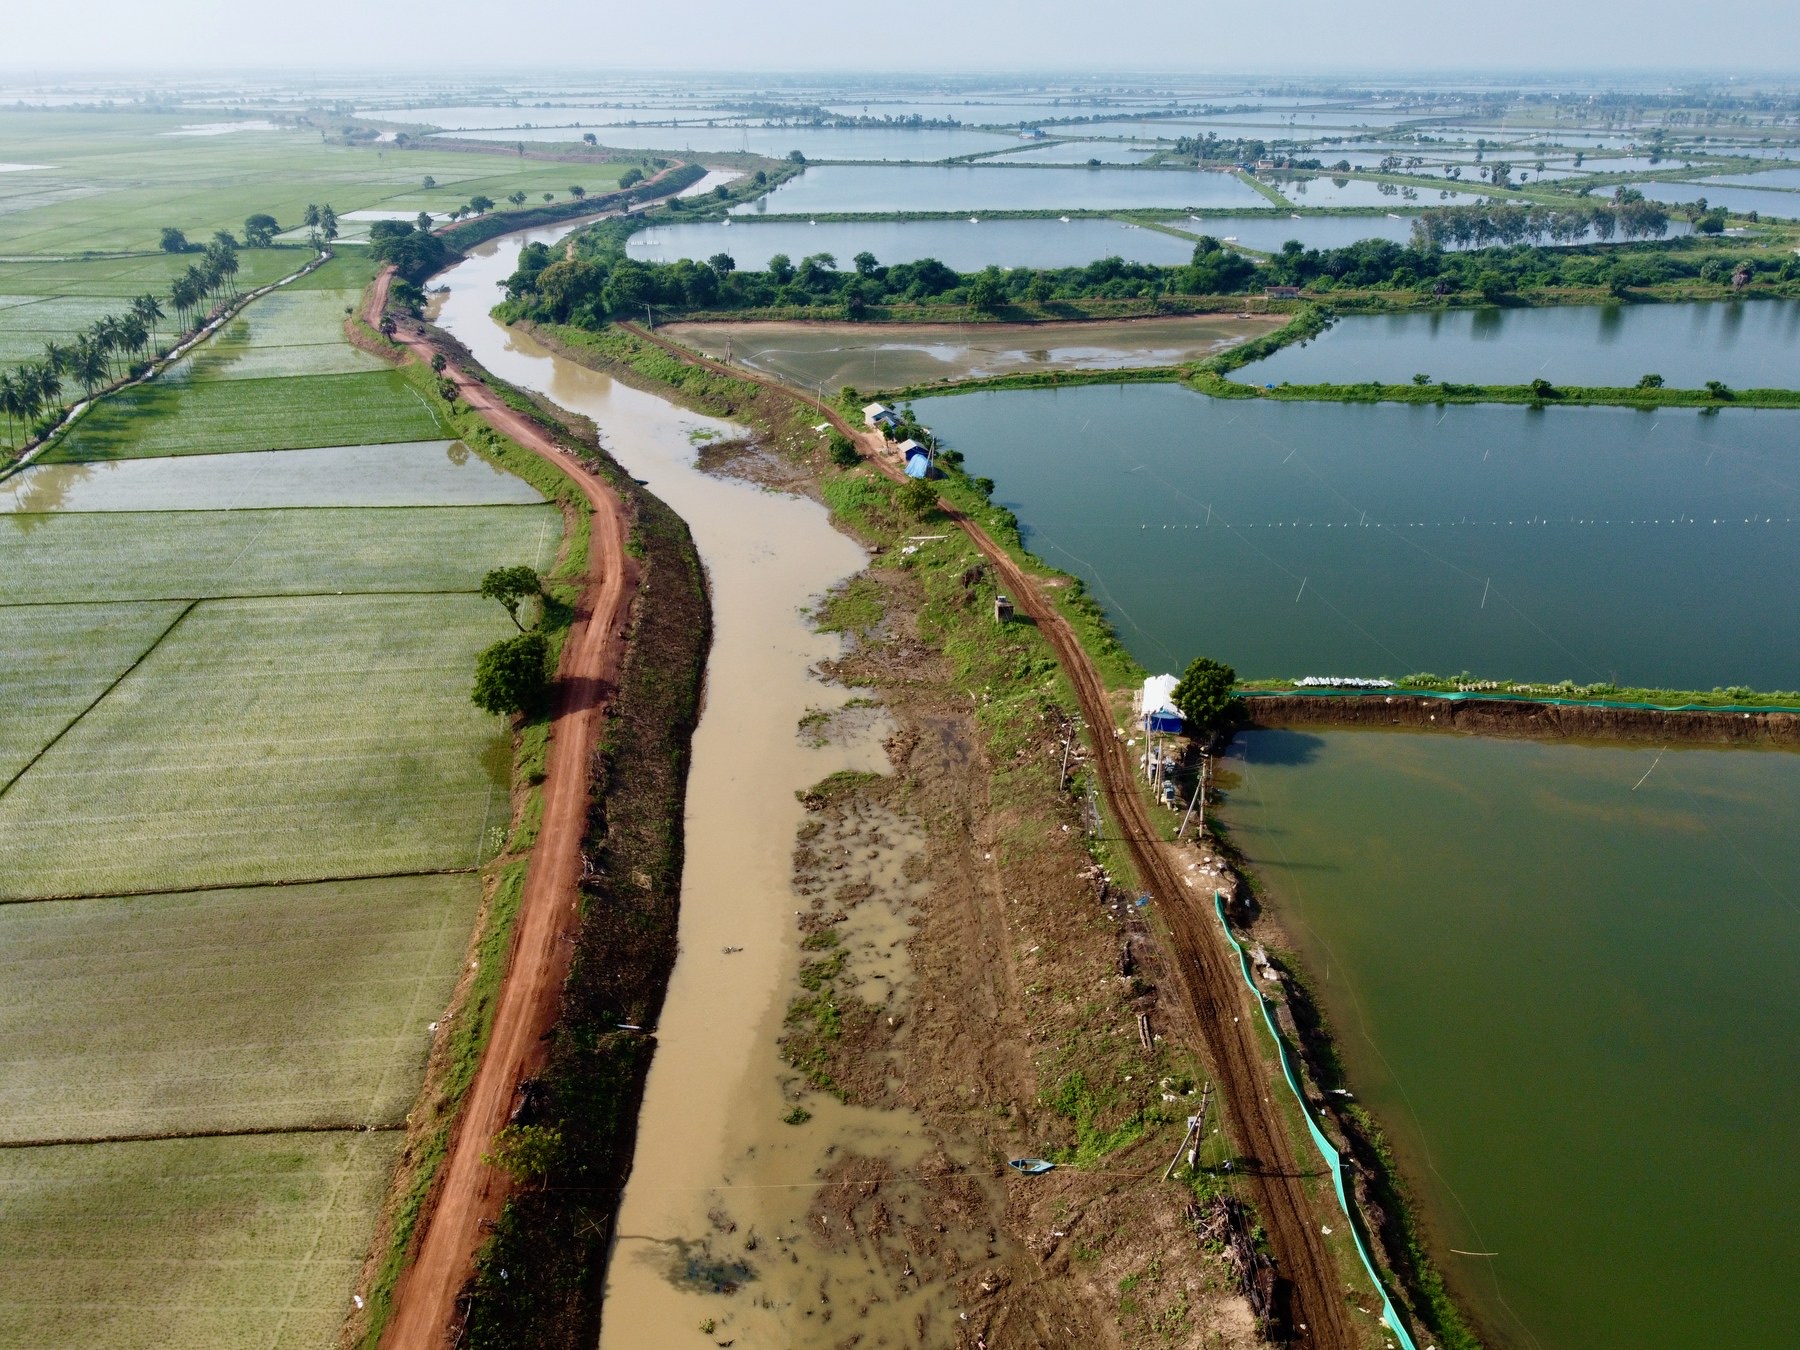
The water you can't see
Most people drink about two litres of water a day and use several thousand, and almost none of it comes out of a tap. Where it goes, how anyone counts it, and why someone who has spent a career inside the water industry decided to write it all down.
Most people drink about two litres of water in a day. A glass with breakfast, a coffee, a bottle at a desk, something with dinner. It is a figure everyone has heard, and it is the only water most people ever think of themselves as using, apart from the shower and the kettle.
It is a small fraction of the truth. The rest of the water in a day was used long before the day began, by plants, animals and machines, in places its user will never see, making the things they ate, wore and picked up. This article is the first one on this site, and it explains what that water is, how it can be counted, and why the person writing it thought it needed a website.
One day's receipt
The launch of this series was a receipt: an ordinary day, added up in litres, with the water that each item carried before it reached the shop.
| An ordinary day | Litres, spent before purchase |
|---|---|
| A cup of coffee | 140 |
| A cotton t-shirt | 2,700 |
| A bar of chocolate | 1,700 |
| A 200 g steak | 3,100 |
| A pair of jeans | 8,000 |
| A glass of drinking water | 0.25 |
A day that includes a new shirt and a new pair of jeans is a heavy day, and most days do not. But a day of ordinary eating, without a single purchase of clothing, runs to thousands of litres, and the global average, worked out by the researchers whose method this site uses, is about 3,800 litres per person per day. In wealthy countries it is higher, and a day with a steak in it is higher still. Two litres drunk; thousands used; almost none of it from a tap.
What hidden water is
The water in that table is real water. It fell as rain on a coffee farm and was drawn up through the roots of a tree. It was pumped from a river onto a cotton field in a dry country. It grew the grain that fed a cow for three years. It filled the dye baths that made a pair of jeans blue and left, coloured, through a pipe. All of it was used, in the plain sense that it passed through something on the way to making a product, and all of it is invisible to the person holding the product, because the using happened somewhere else.
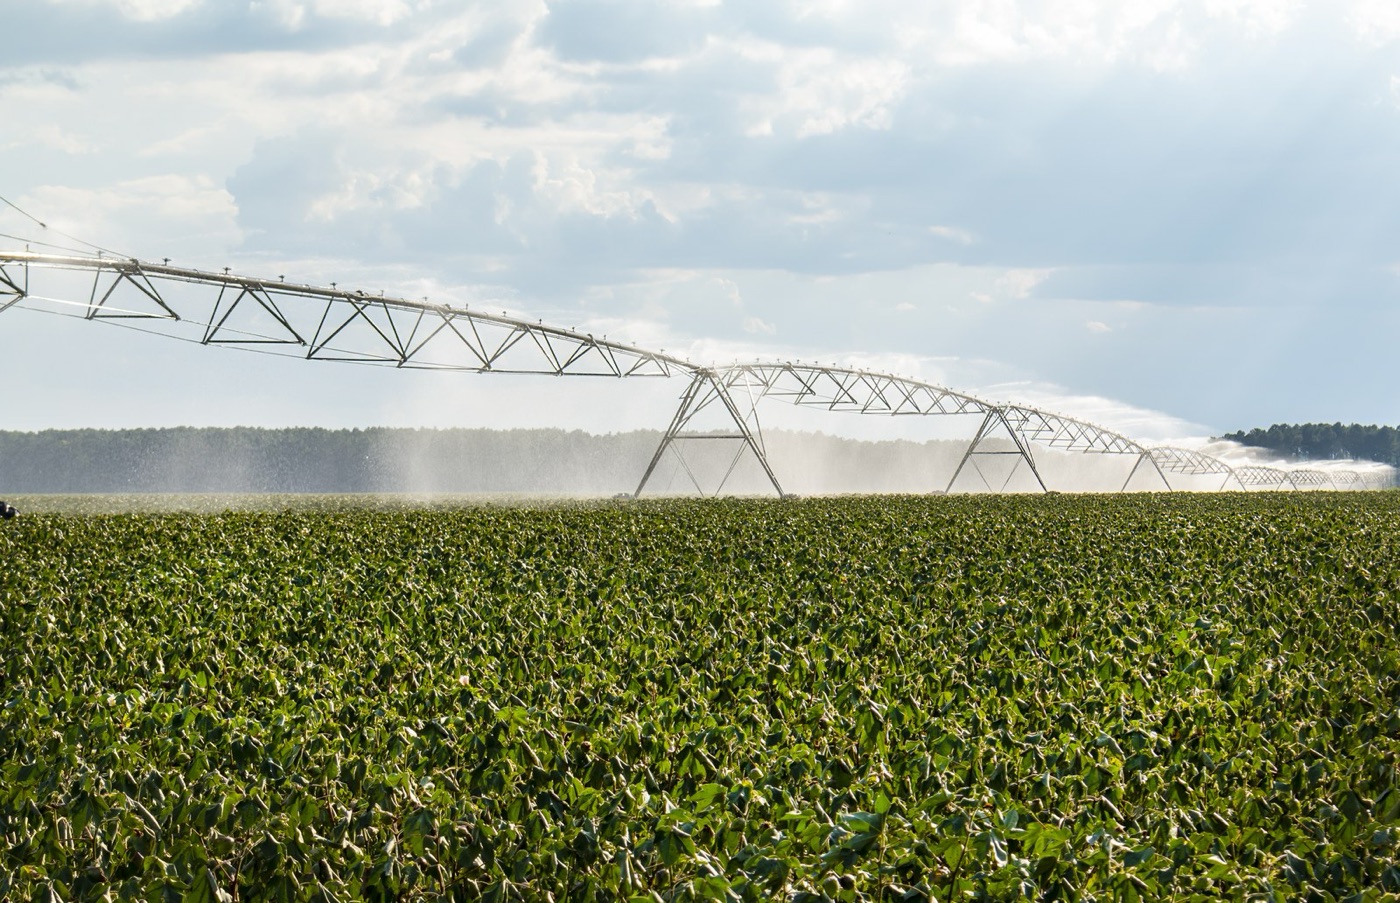
The method that makes it visible was developed by the Water Footprint Network, and it counts three kinds of water: the rain a crop took up, which it calls green; the irrigation applied to it, which it calls blue; and the clean water it would take to dilute the pollution the crop or the factory caused, which it calls grey. Every number on this site is one of those sums, and every article says which kind of water it was, because that turns out to be the question that matters.
| The three kinds of water | |
|---|---|
| Green | Rain, taken up by the crop and returned to the sky |
| Blue | Irrigation, pumped from rivers and groundwater |
| Grey | The clean water needed to dilute what was polluted |
The blue planet, and its film of usable water
We call it the blue planet, and the name is accurate and misleading in equal measure. About 97.5 percent of Earth's water is salt. Of the small fraction that is fresh, most is frozen in Antarctica, Greenland and the world's glaciers, or lies deep underground. What is actually available to eight billion people, every farm and every factory, is a thin film of rivers, lakes and shallow groundwater, well under one percent of the whole, and its own article explains the arithmetic.
Of what people draw from that film each year, agriculture takes about 70 percent. Industry takes about 20. Homes and cities, the taps, the showers and the kettles, take the last 10, which is why the two litres that people drink and the few hundred they use at home are such a small part of their real footprint. The water is in the food and the things, and the food and the things were made in fields and factories.
The 20 percent I know from the inside
That 20 percent, the industry's share, is where I have spent my working life. I have spent it helping factories and cities treat and reuse their water, in dyehouses in Bangladesh, tanneries in India, food plants and sewage works on several continents, and in every one of them the water is doing something that the people who buy the product have never been told about.
After all those years, the thing that still surprises me most is how little any of us know about where water goes, more than how scarce it is becoming, though it is, in many places. I include myself in that. The deeper I go into this industry, the more I find I still have to learn, and the more I notice that the language the industry uses, the terms and the measurements and the machines, keeps the knowledge inside it. A dye house's water, a sewage works, a membrane plant, a digester: none of it is secret, and none of it is ever explained to anyone outside.
What the numbers will not do
A word about what the numbers on this site are for, and what they are not, because the misuse of them is the commonest thing that happens to them.
A water footprint describes how a product was made. It does not describe the person who bought it, and it is not a guilt score. The 140 litres in a cup of coffee were spent on a hillside in Ethiopia, by a tree, and the coffee drinker who gives up the cup returns nothing to the hillside. The 8,000 litres in a pair of jeans were spent in a cotton field and a dye house, and the buyer who does without the jeans has emptied no river and filled none. The water was used where the thing was made, by the people who made it, under the rules and prices of that place, and that is where anything that could be done about it would be done.
What the numbers do is show where the water is. They make a map, and on that map the fields and the factories are where the water goes, and the checkout is a small dot. Once that is seen clearly, the useful questions become obvious: what kind of water it was, rain or river; whether the place could spare it; and what the factory did with it afterwards. Those are the questions this site is built to answer, and they are the ones that lead somewhere.
How the site is organised
The articles fall into a few series, and the series each do a different job.
Thirsty takes one everyday thing at a time, a cup of coffee, a shirt, a steak, and works out the water behind it. These are the numbers, and they are where most readers start.
Thirsty Industries does the same for a whole sector, textiles, food, and follows the water into the factory and out of it.
Plain Water takes the terms the water industry uses every day, wastewater, COD, sludge, and explains them in ordinary language, one at a time. These are the words that make the machines make sense, and they are the part of this site that could only be written from inside.
Myth tests the things everyone says about water against what is actually known.
Thirsty Places goes to the cities and countries that have already solved a water problem, to show that the solutions exist and what it took to build them.
Every article says where its numbers came from, at the end, and every figure uses the same method so that the articles can be read against each other. That consistency is the whole discipline of the site. A number that cannot be defended in an argument does not get published.
What this site is for
Thirsty Planet exists to explain water the way I wish someone had explained it to me: clearly, honestly, and with real numbers, sourced every time. It follows the hidden water inside everyday things, a cup of coffee, a shirt, a steak, a phone, and works out how much it really took to make them and where that water came from. It takes the words the water industry uses all day and turns them into plain language, one term at a time. It tests the things everyone says about water against what is actually known. And it goes to the places, cities and plants, where the water problem has already been solved, to show that the solutions exist.
The promise is a simple one. The numbers will change how you look at almost everything you own. They are not there to make anyone feel guilty, because guilt about water changes nothing and understanding it can. They are there to make visible what was always there, and once the water behind things becomes visible, it is very hard to stop seeing it.
That is the water you can't see. This is where it starts.
Sources
- Hoekstra, A.Y. and Mekonnen, M.M. (2012). The water footprint of humanity. Proceedings of the National Academy of Sciences 109. Global average water footprint of consumption about 1,385 cubic metres per person per year, roughly 3,800 litres a day, with national averages from under 2,000 to above 6,000 litres a day.
- Water Footprint Network; Mekonnen and Hoekstra (2011), for the products in the day's receipt.
- USGS Water Science School and Shiklomanov (1993), for the partition of the world's water; FAO AQUASTAT for withdrawals by sector.
- Photographs: opener: An irrigation canal near Kovvali, Eluru by iMahesh (CC BY-SA) via Wikimedia Commons; Cesar Chu Ortega; inline: Irrigation in Cotton Field - 51488231980 by Alabama Extension (CC0) via Wikimedia Commons.